The first half of this article introduced Shipwars, a browser-based video game that’s similar to the classic Battleship tabletop game, but with a server-side AI opponent. We set up a development environment to analyze real-time gaming data and I explained some of the ways you might use game data analysis and telemetry data to improve a product.
In this second half, we'll run the analytics and use the captured data to replay games.
Using Kafka Streams for game analytics
We're using the Kafka Streams API along with Red Hat OpenShift Streams for Apache Kafka and Red Hat OpenShift Application Services in the Developer Sandbox for Red Hat OpenShift. Please see the first half of this article to set up the environment for analyzing data captured during gameplay.
The Shipwars architecture contains several independent Java applications that use the Kafka Streams API. The source code for these applications is in the shipwars-streams repository on GitHub. We'll deploy each of the applications for game data analysis.
Deploy the Kafka Streams enricher
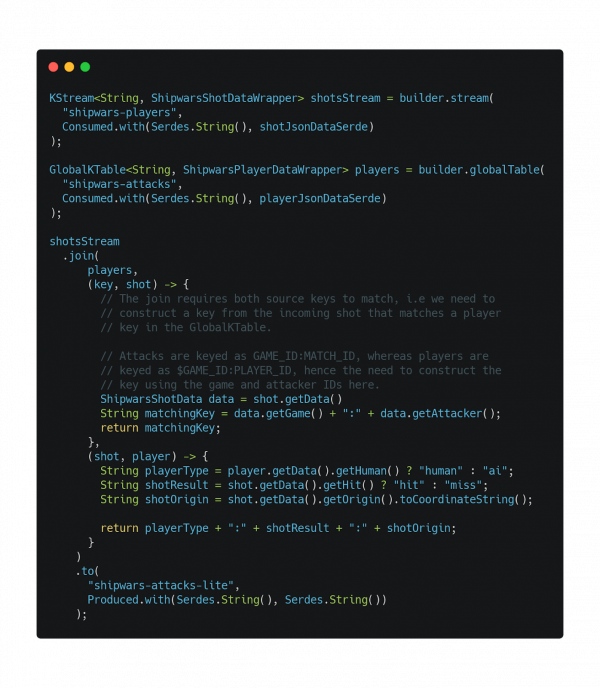
The first Kafka Streams application you’ll deploy is an enricher. It performs a join between two sources of data: Players and Attacks (also known as "shots"). Specifically, this application performs a KStream-GlobalKTable join. The join involves deserializing the JSON data from two Kafka topics into POJOs using Serdes for serialization and deserialization. Then, we use the Kafka Streams DSL to join the data sources.
A GlobalKTable stores key-value pairs. In this application, the key is the player ID and the value is the player data; that is, the username and whether they are a (supposed) human or an AI bot. An entry is added to this table each time a player is created by the game server, because the game server emits an event with the player data to the shipwars-players topic that the GlobalKTable is subscribed to.
A KStream is an abstraction above a stream of events in a specific topic. Kafka Streams applications can map, filter, and even join KStream instances with one another and instances of GlobalKTable. The Shipwars application demonstrates this feature.
Every attack made in Shipwars arrives on a KStream subscribed to the shipwars-attacks topic. It is then joined with the associated player data in the GlobalKTable to create a new record. The relevant code is included in Figure 1. Also see the a TopologyShotMapper repository on GitHub.
Deploy the application
Take the following steps to deploy the Kafka Streams enricher application:
- Navigate to your project in the Developer Sandbox UI.
- Ensure that the Developer view is selected in the side menu.
- Click the +Add link and select Container Image from the available options.
- Paste
quay.io/evanshortiss/shipwars-streams-shot-enricherinto the Image name field. - Select Quarkus as the Runtime icon.
- Under General, select Create Application and enter
shipwars-analysisas the Application name. - Leave the Name as the default value.
- Click the Deployment link under the Advanced options. This reveals a new form element to enter environment variables.
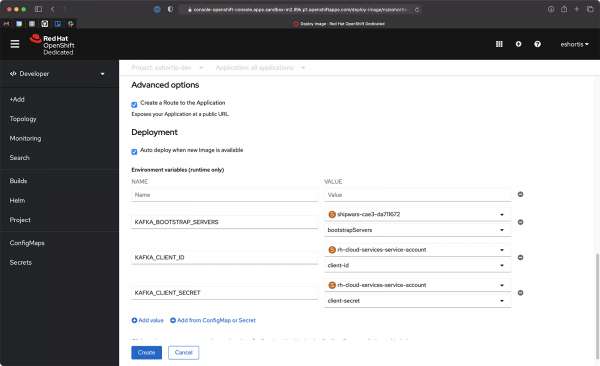
- Click the Add from ConfigMap or Secret button and create the following variables (also shown in Figure 2):
KAFKA_BOOTSTRAP_SERVERS: Select the generatedshipwarssecret and use thebootstrapServerskey as the value.KAFKA_CLIENT_ID: Select therh-cloud-services-service-accountsecret and use theclient-idvalue.KAFKA_CLIENT_SECRET: Select therh-cloud-services-service-accountsecret and use theclient-secretvalue.
- Click the Create button to deploy the application.
Play a round of Shipwars
Now you’ve successfully deployed the first Kafka Streams application. It should appear as a Quarkus icon in the OpenShift Topology view. The blue ring around it indicates that the application is in a healthy running state.
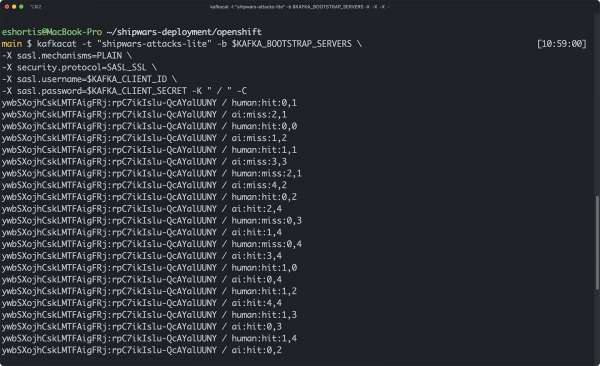
Next, open the shipwars-client NGINX application URL, then open the Kafka Streams shipwars-streams-shot-enricher application pod logs in another browser window. Play a match of Shipwars and watch the pod logs as you play. The shipwars-streams-shot-enricher application prints a log each time it receives an attack event, and joins the event information with the associated player record. This joined record is then written to the shipwars-attacks-lite Kafka topic.
If you’d like to view the data in the new topic, you can do so using a Kafka client such as kafkacat, which is shown in Figure 3.
Deploy the Kafka Streams aggregators
The next two Kafka Streams applications perform aggregations. These aggregations are stateful operations that track the rolling state of a value for a particular key.
Shot distribution
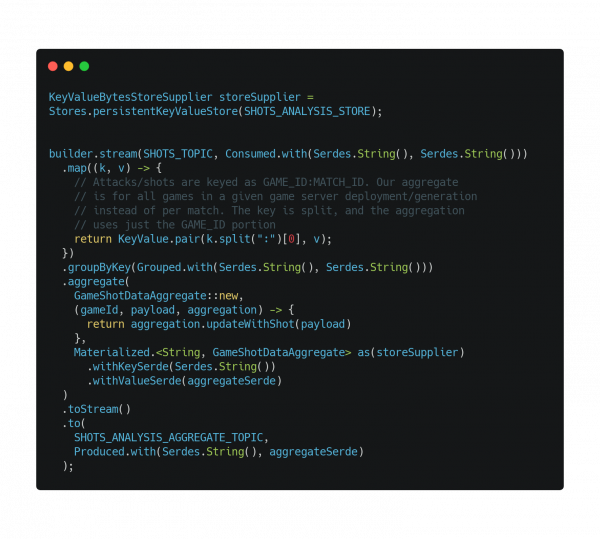
The first application, the shot distribution aggregator, aggregates the total number of shots against each cell on the 5x5 grid used by Shipwars. This aggregate breaks down into the following integer values:
- AI hit
- AI miss
- Human hit
- Human miss
To create this aggregation, you need the data output by the Kafka Streams enricher you deployed previously. The data in the shipwars-attacks topic doesn’t specify whether the attacker was a human or AI. The joined data does specify this important piece of information.
There are two other interesting aspects of this application:
- It uses MicroProfile Reactive Streams to expose the enriched data stream via HTTP server-sent events. You’ll see this in action soon.
- It stores the aggregated data and exposes it for queries via HTTP REST endpoints.
You will find the Kafka Streams DSL code for the shot distribution aggregator in the TopologyShotAnalysis repository. Figure 4 shows the relevant code.
We used the second aggregation at Red Hat Summit 2021. It forms a complete record of all turns for each match, so that you can analyze them later or even replay them as we did in our demonstration.
Deploy the aggregators
Both applications can be deployed in the exact same manner as the enricher. Simply use quay.io/evanshortiss/shipwars-streams-shot-distribution and quay.io/evanshortiss/shipwars-streams-match-aggregates as the Image name and add each to the shipwars-analysis application that you created for the enricher application. View the logs once each application has started. Assuming you played a Shipwars match, you should immediately see logs stating that the aggregate shots record has been updated for a specific game ID.
Use the Open URL button on the shipwars-streams-shot-distribution node in the OpenShift Topology view to access the exposed route for the application. Append /shot-distribution to the opened URL, in the following format:
http://shipwars-streams-shot-distribution-$USERNAME-dev.$SUBDOMAIN.openshiftapps.com/shot-distribution
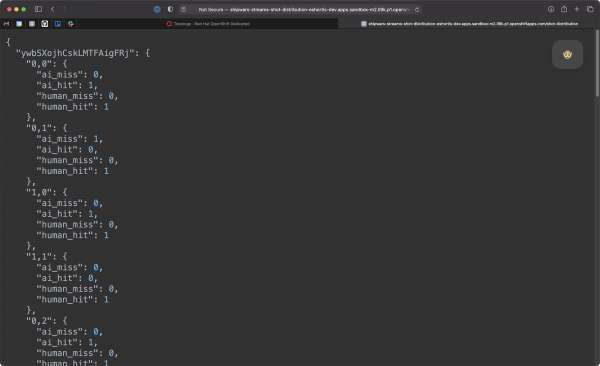
The endpoint will return the aggregations in JSON format, as shown in Figure 5. The top-level keys are the game generation IDs. Each nested key represents a cell (X, Y coordinate) on the game grid, and contains the resulting hits and misses against that cell, classified by player type.
Using the aggregated data
This aggregated data could be used in various ways. The Python AI move service could query it and adapt the game difficulty based on the hit rate of players. Alternatively, we could use the data to display a heatmap of shot activity, as you’ll see shortly.
You can view aggregated match records using the same approach. Click the Open URL button on the shipwars-streams-match-aggregate node in the OpenShift Topology view, and append /replays to the URL to view match records.
Analyzing attacks in real-time
We use SmallRye and MicroProfile Reactive Streams, exposed by the shipwars-streams-shot-distribution application, to create visualizations of the attacks on a real-time heatmap. The application is custom in this case, but it’s common to ingest the data into other analysis tools and systems using Kafka Connect.
You can test this endpoint by starting a cURL request using the following commands, and then playing the Shipwars game in your browser:
$ export AGGREGATOR_ROUTE=$(oc get route shipwars-streams-shot-distribution -o jsonpath='{.spec.host}')

$ curl http://$AGGREGATOR_ROUTE/shot-distribution/stream
Your cURL request should print data similar to the result shown in Figure 6.

Deploy the heatmap application
Once you’re satisfied that the endpoint is working as expected, you can deploy the heatmap application. This is a web-based application that uses TypeScript, Tailwind CSS, and Parcel Bundler. We're using Node.js to run the build tools, and NGINX serves the resulting HTML, CSS, and JavaScript.
Use the oc new-app command to build the application on the Developer Sandbox via a source-to-image process, and deploy the application:
# The builder/tools image
export BUILDER=quay.io/evanshortiss/s2i-nodejs-nginx
# Source code to build
export SOURCE=https://github.com/evanshortiss/shipwars-visualisations
# The public endpoint for the API exposing stream data
export ROUTE=$(oc get route shipwars-streams-shot-distribution -o jsonpath='{.spec.host}')


oc new-app $BUILDER~$SOURCE \
--name shipwars-visualisations \
--build-env STREAMS_API_URL=http://$ROUTE/ \
-l app.kubernetes.io/part-of=shipwars-analysis \
-l app.openshift.io/runtime=nginx
The new application shows up in the OpenShift Topology view immediately, but you’ll need to wait for the build to complete before the application becomes usable. Click the Open URL button to view the application UI when the build has finished. A loading spinner is displayed initially, but once you start to play Shipwars in another browser window the heatmap will update in real-time, similar to the display in Figure 7.
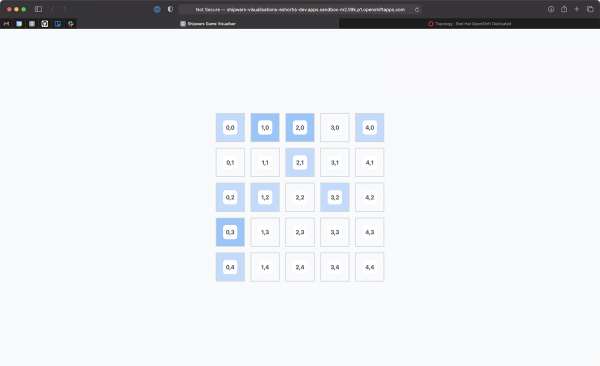
Squares that are targeted frequently will appear darker than squares that are targeted less often. Of course, our game has a low resolution of only 5x5, but in a game with larger maps (such as the first-person shooter games mentioned in the first half of this article) players would tend to spend more time in areas with better weapons and tactical cover. This would result in a useful heatmap for analyzing player behavior.
Viewing the replays
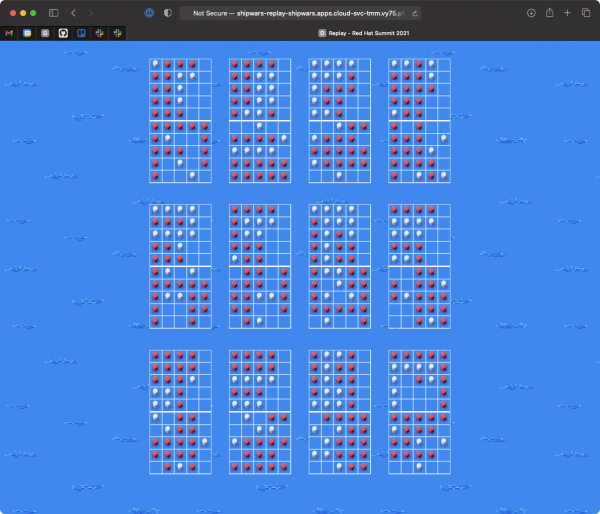
The interface we used to view replays at Red Hat Summit 2021 was created by Luke Dary. You can view the aggregated match replays by deploying the UI like so:
$ oc new-app quay.io/evanshortiss/shipwars-replay-ui \
-l "app.kubernetes.io/part-of=shipwars-analysis" \
-e REPLAY_SERVER="http://shipwars-streams-match-aggregates:8080" \
--name shipwars-replay

$ oc expose svc shipwars-replay
Once the application is deployed, you can view the replays by opening the application URL in a web browser. The replay UI is shown in Figure 8.
Conclusion
If you made it this far, well done! You’ve learned how to:
- Use the Red Hat OpenShift Application Services CLI to interact with OpenShift Streams for Apache Kafka.
- Connect your OpenShift environment to your managed Kafka instances.
- Deploy applications into an OpenShift environment using the OpenShift UI and CLI.
- Use Kafka Streams to create data processing architectures with OpenShift Streams for Apache Kafka.
Using an OpenShift cluster and OpenShift Streams for Apache Kafka allows you to focus on building applications instead of infrastructure. Better yet, your applications can run anywhere and still utilize OpenShift Streams for Apache Kafka. The Shipwars application now includes instructions for a Docker Compose deployment that can connect to the managed Kafka service. We suggest giving that a try next.
Last updated: September 19, 2023