This article is aimed at users who would like to integrate or monitor their Red Hat OpenShift cluster using the Datadog monitoring solution. We will use the Datadog Operator to instantiate our agent and collect all metrics, cluster and container/pod logs, network, CPU, and memory consumption.
Prerequisites
- User with the cluster-admin cluster role
- OpenShift 4.12 or above
- Datadog account
Procedure
1. Create the Datadog API key:
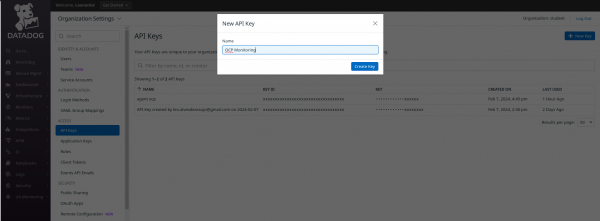
- To add a new Datadog API key, navigate to Organization Settings > API Keys.
- If you have the permission to create API keys, click New Key in the top right corner.
- Define the desired name, as shown in Figure 1.
- Once created, copy the key so you can use it later.
Create a new Datadog application key:
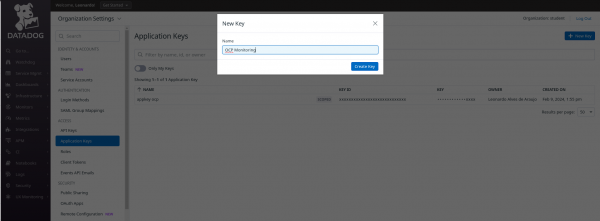
- Navigate to Organization Settings > Application Keys.
- If you have the permission to create API keys, click New Key in the top right corner.
- Define the desired name (Figure 2).
- Once created, copy the key so we can use it later.
Install the Datadog Operator: In the OpenShift console, in the left side menu, click Operator > OperatorHub and in the search field, type datadog (Figure 3).
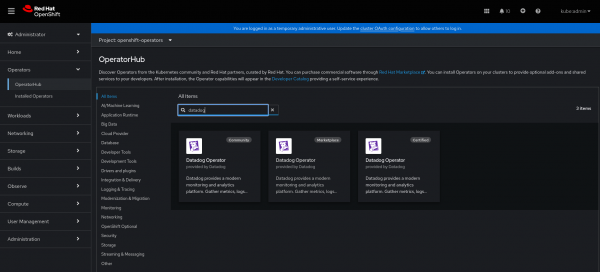
Whenever available, use a certified option. As shown in Figure 3, we are using version 1.3.0.
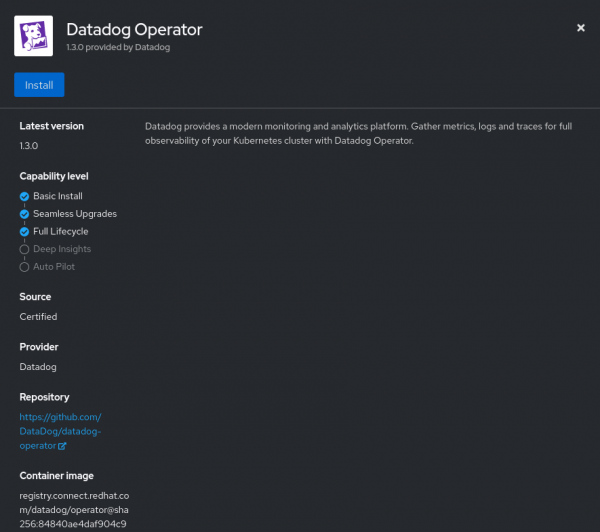
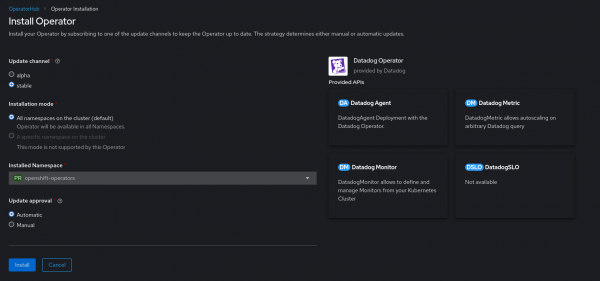
Click Install (Figure 4).
On this screen, we will keep all the default options:
- Update channel: stable
- Installation mode: All namespaces on the cluster (default)
- Installed Namespace:
openshift-operators - Update approval: Automatic
- If you prefer, you can use the Manual option.
Click Install (Figure 5).
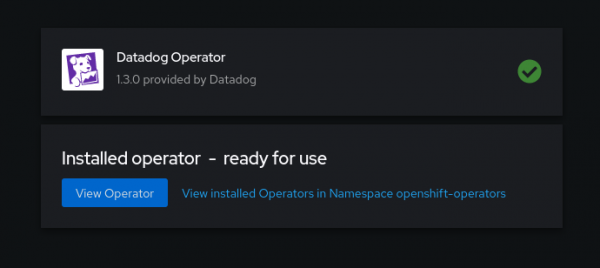
Wait for the installation to complete (Figure 6).
Create a secret with Datadog keys: In the terminal, access the openshift-operators namespace context.
$ oc project openshift-operators
Now let's create a secret to store in this API key and application key. Replace the values below with the keys we generated previously in the Datadog console:
$ oc create secret generic datadog-secret \
--from-literal api-key=`REPLACE_ME` \
--from-literal app-key=`REPLACE_ME`
Let's now instantiate our Datadog agent using the YAML below:
$ cat <<EOF > datadog_agent.yaml
apiVersion: datadoghq.com/v2alpha1
kind: DatadogAgent
metadata:
  name: datadog
  namespace: openshift-operators
spec:
  features:
    apm:
      enabled: true
      unixDomainSocketConfig:
        enabled: true
    clusterChecks:
      enabled: true
      useClusterChecksRunners: true
    dogstatsd:
      originDetectionEnabled: true
      unixDomainSocketConfig:
        enabled: true
    eventCollection:
      collectKubernetesEvents: true
    liveContainerCollection:
      enabled: true
    liveProcessCollection:
      enabled: true
    logCollection:
      containerCollectAll: true
      enabled: true
    npm:
      collectDNSStats: true
      enableConntrack: true
      enabled: true
  global:
    clusterName: DemoLab
    credentials:
      apiSecret:
        keyName: api-key
        secretName: datadog-secret
      appSecret:
        keyName: app-key
        secretName: datadog-secret
    criSocketPath: /var/run/crio/crio.sock
    kubelet:
      tlsVerify: false
    site: datadoghq.eu
  override:
    clusterAgent:
      containers:
        cluster-agent:
          securityContext:
            readOnlyRootFilesystem: false
      replicas: 2
      serviceAccountName: datadog-agent-scc
    nodeAgent:
      hostNetwork: true
      securityContext:
        runAsUser: 0
        seLinuxOptions:
          level: s0
          role: system_r
          type: spc_t
          user: system_u
      serviceAccountName: datadog-agent-scc
      tolerations:
      - operator: Exists
      - effect: NoSchedule
        key: node-role.kubernetes.io/master
EOF
Some explanations about what we are enabling in this agent are provided below.
Enabling the Application Performance Monitoring (APM) feature:
apm:
  enabled: true
  unixDomainSocketConfig:
    enabled: true
clusterCheck extends the autodiscover function to non-containerized resources and checks if there is some integration/technology to monitor:
clusterChecks:
  enabled: true
  useClusterChecksRunners: true
dogstatsd is responsible for collecting custom metrics and events and sending them from time to time to a metrics aggregation service on the Datadog server.
dogstatsd:
  originDetectionEnabled: true
  unixDomainSocketConfig:
    enabled: true
Here we are enabling the collection of all logs (including container logs) and events generated in our cluster and sending them to Datadog.
eventCollection:
  collectKubernetesEvents: true
liveContainerCollection:
  enabled: true
liveProcessCollection:
  enabled: true
logCollection:
  containerCollectAll: true
  enabled: true
With network performance monitoring (NPM), we can have visibility of all traffic in our cluster, nodes, containers, availability zones, and etc.
npm:
  collectDNSStats: true
  enableConntrack: true
  enabled: true
In the credentials block in Global, we have the definition of the secret previously created with the API and APP key.
credentials:
  apiSecret:
    keyName: api-key
    secretName: datadog-secret
  appSecret:
    keyName: app-key
    secretName: datadog-secret
In this block, we define the path to the CRI-O service socket, we define the non-checking of TLS for communication with the kubelet and in website, we define which Datadog server will receive the data sent.
criSocketPath: /var/run/crio/crio.sock
kubelet:
  tlsVerify: false
site: datadoghq.eu
In the clusterAgent block in override, we add securityContext (scc) settings and which serviceaccount should be used in the datadog-cluster-agent pods.
clusterAgent:
  containers:
    cluster-agent:
      securityContext:
        readOnlyRootFilesystem: false
  replicas: 2
  serviceAccountName: datadog-agent-scc
Note
The datadog-agent-scc serviceaccount is created automatically by the operator and already has all the necessary permissions for the agent to run correctly.
In the nodeAgent block in override, we define securityContext settings for the datadog-agent pods. We will use the same datadog-agent-scc service account and also define the tolerations for the nodes that have taints created, in our case, for the primary nodes.
nodeAgent:
  hostNetwork: true
  securityContext:
    runAsUser: 0
    seLinuxOptions:
      level: s0
      role: system_r
      type: spc_t
      user: system_u
  serviceAccountName: datadog-agent-scc
  tolerations:
  - operator: Exists
  - effect: NoSchedule
    key: node-role.kubernetes.io/master
Now let's deploy our Datadog agent. Execute this command to create the object:
$ oc -n openshift-operators create -f datadog_agent.yaml
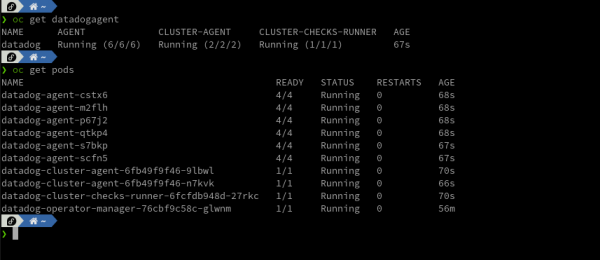
Once created, we will validate that our agent was created correctly (see Figure 7):
$ oc -n openshift-operators get datadogagent
$ oc -n openshift-operators get pods
Here we should have a datadog-agent running on each available OpenShift node.
Note:
datadog-agent-xxxxxpods are responsible for collecting all metrics, events, traces and logs from each node in the cluster.datadog-cluster-agent-xxxxxpods will act as a proxy between the API server and node-based agents, Cluster Agent helps to ease the server load.
Now let's validate the logs of the datadog-agent-xxxxx pods to identify if there is any communication error (Figure 8):
$ oc logs -f -l app.kubernetes.io/managed-by=datadog-operator --max-log-requests 10

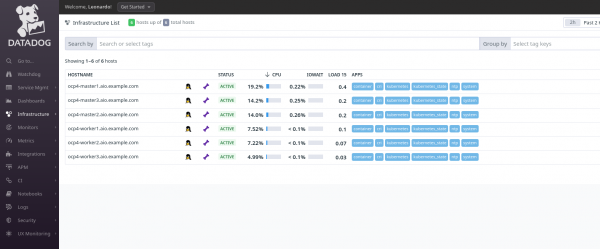
datadog-agent-xxxxx pod logs.Now on the Datadog platform, in the left side menu, click Infrastructure > Infrastructure List.
Info alert: Note
Server data, such as status, CPU information, memory and other details, might take a few minutes to display.
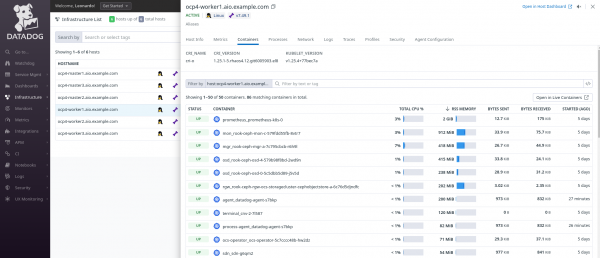
To view more details about a specific node, click on the node name and navigate through the available tabs (Figure 10). It’s just the simple way to check your nodes/hosts.
Under the Infrastructure menu, Datadog also gives you an exclusive Kubernetes menu that provides the full picture about your cluster. You can check the state of all of your Kubernetes resources, troubleshoot patterns, access out-of-the-box Dashboards and enable some recommended Alerts to monitor your environment.
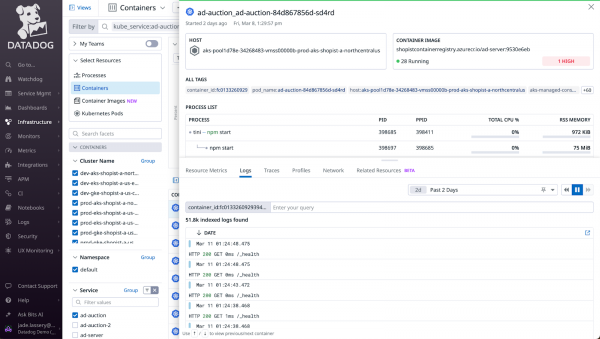
You can also explore deeper the containers running in your OpenShift environment by going to Infrastructure > Containers. Here you get a chance to analyze things like logs from containers, traces, networking layer, processes running inside the container, and so on. See Figure 11.
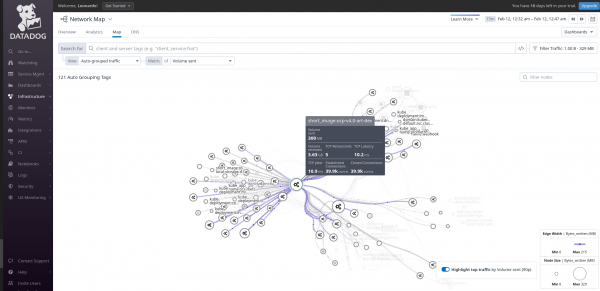
To view more details about network traffic, in the left side menu, go to Infrastructure > Network Map (Figure 13).
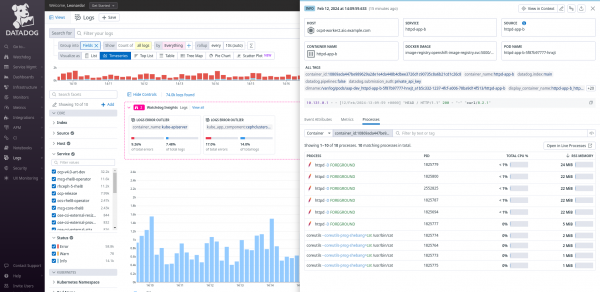
To view the logs received from the cluster or from any application or technology running in your Kubernetes environment, in the left side menu, go to Logs > Analytics. On this screen, we can view all the details, filter application logs, and even view the processes.
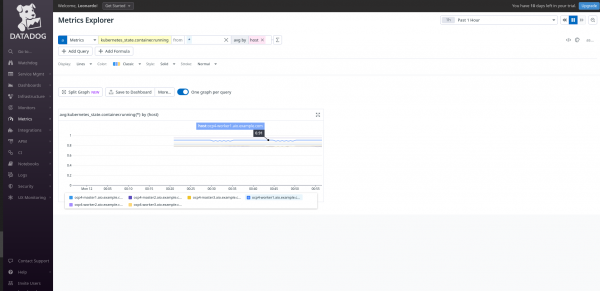
To view all collected metrics, in the left side menu, go to Metrics > Explorer. Here we can view all metrics, run and save queries or create dashboards based on queries.
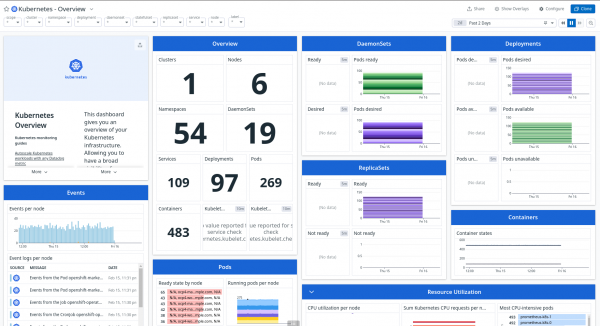
Datadog provides out-of-the-box Dashboards that can be used and customized. To use one available, go to Dashboards > Dashboard List in the left-side menu, choose the dashboard, and click on the name.
Info alert: Note
To customize a dashboard provided by Datadog, use the Clone feature to make the desired changes and save.
Conclusion
Using the Datadog Operator solution, we can have a complete monitoring solution for our OpenShift cluster with main features such as APM, network analysis, logs, events, and metrics.
- Request an OpenShift trial and learn more about our solution.
- Request a Datadog trial to replicate this knowledge.
Info alert: Note
Red Hat does not support the Datadog Operator or its configuration. For any questions related to the use of the platform or the operator, contact Datadog.
References
For more details and other configurations, start with these reference documents:
