Arm chips are often thought of as chips for small and dedicated embedded systems, but that hasn’t been the case for a while. In this series, we’ll review a couple of benchmarks done on server grade Arm aarch64 chips.
To make things clear from the get-go, "Arm" is NOT an architecture or a chip vendor, though it's often confused for these things. Actually, it’s the name of the intellectual property (IP) provider for many IPs, including the architecture in question, "aarch64". So, the actual architecture name is "aarch64", and similarly, another well known architecture in datacenters is "x86_64".
Server and chip overview
In this series we will use two types of servers: one that will serve as a traffic generator and the other as the device under test (DUT), which is an aarch64 system. The DUT has 80 Neoverse-N1 cores clocked at 3.00GHz, 250GB of memory DDR4 RDIMM 3200 MHz and Mellanox Technologies MT2892 Family [ConnectX-6 Dx] network adapter. The traffic generator is another server grade system, which we’ll tell if it became the bottleneck for the test.
As CPU cache sizes are very impactful on performance, we have a handy summary table below for the CPU type we used.
Cache sizes | Neoverse-N1 |
L1 | 64Ki Instruction and 64Ki Data per Core |
L2 | 1 MiB per Core |
SLC/L3 | 32 MiB |
Tests and test topology
We have two servers. One is used as a traffic generator and the DUT server. For the sake of narrowing our focus, we will only report the results from the DUT. They are connected to a 100Gbps switch that has its ports isolated by a VLAN.
For the DUT server, Collaborative Processor Performance Control (CPPC) and Lower Power Idle (LPI) are disabled in BIOS.
The kernel is configured for 4k page size and the kernel cmdline for aarch64 is as follows:
intel_iommu=on default_hugepagesz=1G hugepagesz=1G hugepages=16 pci=realloc isolcpus=55,57,119,121 iommu.passthrough=1The tests require two cores: one for the application and another for the NIC interrupts. The cmdline specifies two other cores that don’t exist, and that’s just to ease the configuration.
It’s worth highlighting that iomem.strict was used with the default value. For the DUT, it’s 1.
Write allocation to system level cache (SLC) was enabled with:
# setpci -s 0000:00:01.0 8e8.l=78007800We will use this configuration for all the posts on this series, unless advised, while varying the connectivity in terms of logical network interfaces. That is, add tunneling, OvS, etc. and some other aspects, such as Adaptive Interrupt Coalescing (AIC) and power savings.
Regarding tests, we’ll run iperf3 TCP single stream and UDP with big (MTU-sized) and small (60 bytes) packets. We’ll analyze the performance observed and CPU usage. All of them run for 60 seconds, ten times.
The basics
The most simple configuration for a server is to use the NIC without any extra layer on it. That is, bare Ethernet. That’s what we will cover in this article. We will only turn AIC off in ethtool which is a known tuning for performance and also to make tests more stable.
To turn AIC off, we use:
# ethtool -C <interface> adaptive-rx off adaptive-tx offTests with ELN
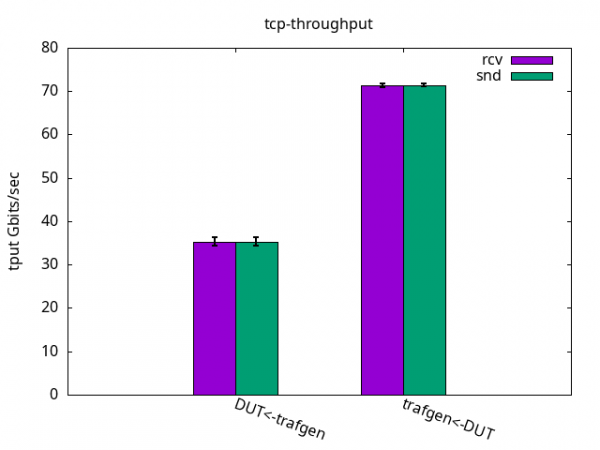
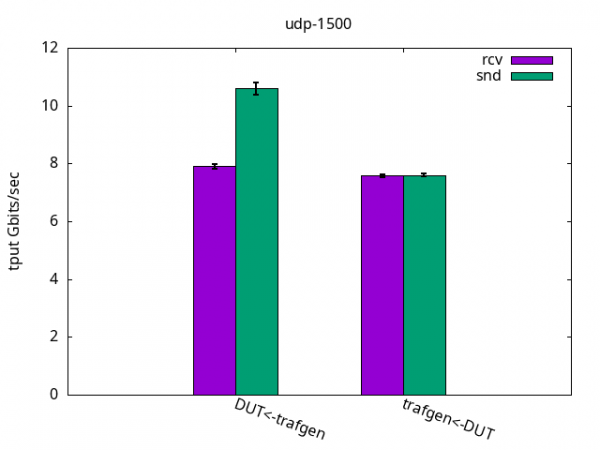
With an ELN kernel, kernel-6.9.0-0.rc4.37.eln136, the results are the following. Each pair of bars is a test. For example, in the first pair, the generated traffic is in green while the received traffic by the DUT is in purple. For TCP they are the same but they will vary on UDP tests. The error markers are stdev out of 10 runs of 1 minute.
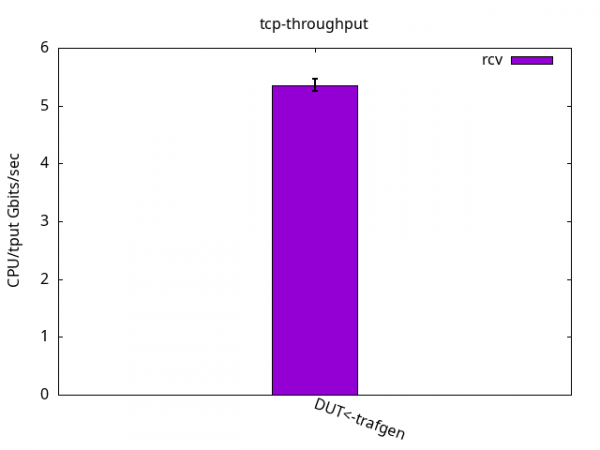
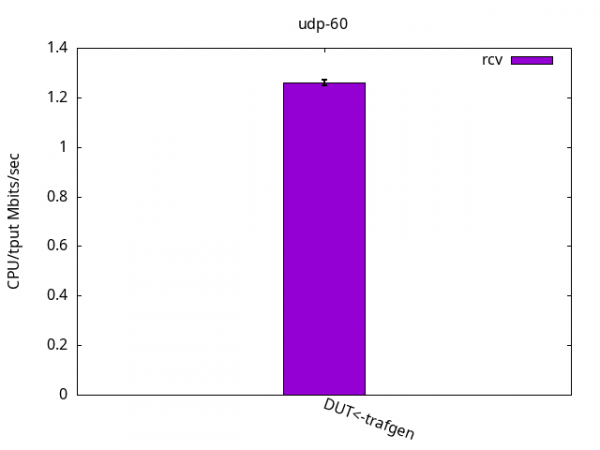
For the CPU/throughput graphs, the total CPU consumption for both cores, application and IRQ, are summed (theoretical maximum of 200 then) and then divided by the observed throughput. The lesser the number, the better (less CPU used to pump the same amount of traffic).
TCP throughput
TCP tests were always limited by the receiver CPU usage, including on the traffic generator side when the DUT was sending traffic. The DUT was able to send 71.44+-0.40Gbps and to receive 35.28+-0.96Gbps, as you can observe in the following graph (see Figure 1).
Figures 2 and 3 below details the CPU utilization.
                 DUT rcv
                    CPU App %usr     2.7+-0.5
                    CPU App %sys     86.2+-1.6
                    CPU App %irq     0.0+-0.0
                    CPU App %soft    0.0+-0.0
                    CPU App %idle    11.1+-1.3
                    CPU S-IRQ %usr   0.0+-0.0
                    CPU S-IRQ %sys   0.1+-0.0
                    CPU S-IRQ %irq   0.0+-0.0
                    CPU S-IRQ %soft  99.9+-0.1
                    CPU S-IRQ %idle  0.1+-0.0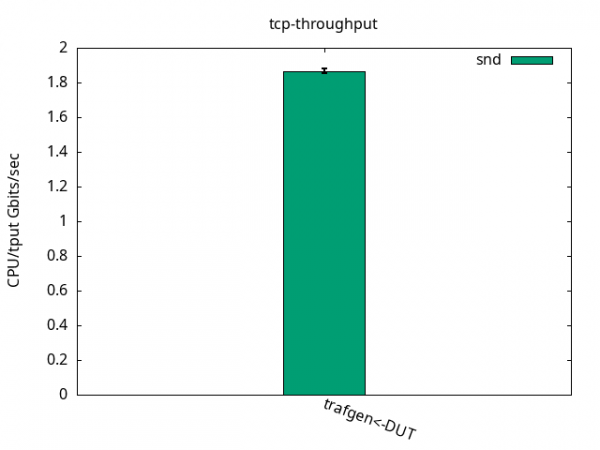
                 DUT snd
                    CPU App %usr     1.1+-0.1
                    CPU App %sys     90.0+-0.9
                    CPU App %irq     0.0+-0.0
                    CPU App %soft    0.0+-0.0
                    CPU App %idle    8.8+-1.0
                    CPU S-IRQ %usr   0.0+-0.0
                    CPU S-IRQ %sys   0.2+-0.3
                    CPU S-IRQ %irq   0.0+-0.0
                    CPU S-IRQ %soft  42.1+-0.9
                    CPU S-IRQ %idle  57.8+-1.0
UDP 1500 bytes
UDP is different from TCP because it doesn’t have accelerations like TCP Segmentation Offload (TSO) and doesn’t pace itself. That means sender and receiver now can walk at their own pace, which is shown in Figure 4. Here, for sending and also receiving, the DUT performance was limited by the application CPU only, while it still had some CPU %idle time left on the IRQ CPU, as shown in Figures 5 and 6 and their respective tables.
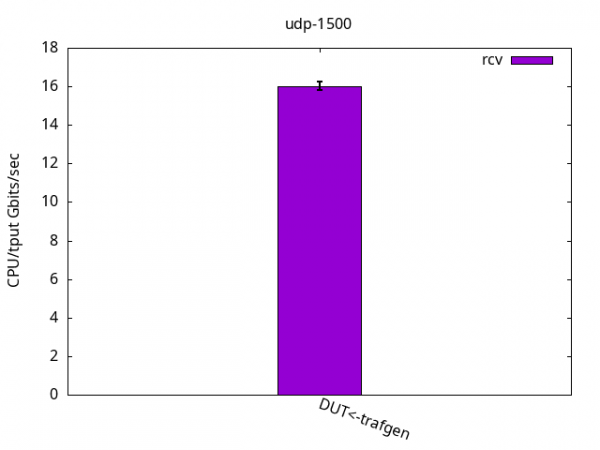
                 DUT rcv
                    CPU App %usr     14.3+-0.5
                    CPU App %sys     85.7+-0.5
                    CPU App %irq     0.0+-0.0
                    CPU App %soft    0.0+-0.0
                    CPU App %idle    0.0+-0.0
                    CPU S-IRQ %usr   0.1+-0.3
                    CPU S-IRQ %sys   0.1+-0.2
                    CPU S-IRQ %irq   0.0+-0.0
                    CPU S-IRQ %soft  26.4+-1.6
                    CPU S-IRQ %idle  73.4+-1.7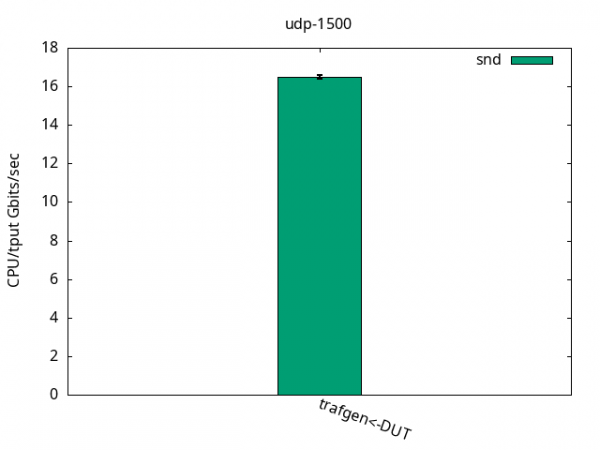
                 DUT snd
                    CPU App %usr     7.3+-0.5
                    CPU App %sys     92.6+-0.5
                    CPU App %irq     0.0+-0.0
                    CPU App %soft    0.0+-0.0
                    CPU App %idle    0.1+-0.0
                    CPU S-IRQ %usr   0.1+-0.2
                    CPU S-IRQ %sys   0.0+-0.0
                    CPU S-IRQ %irq   0.0+-0.0
                    CPU S-IRQ %soft  25.3+-0.6
                    CPU S-IRQ %idle  74.6+-0.8
UDP 60 bytes
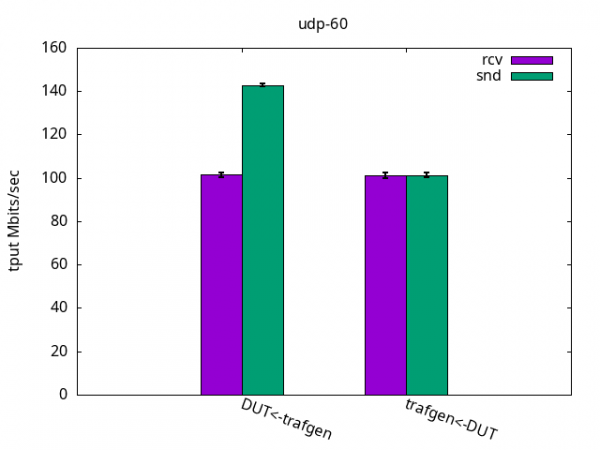
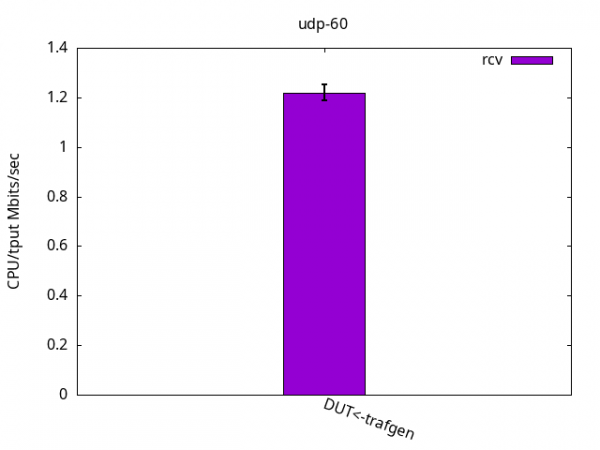
This test is interesting because it’s often viewed as an "ops/sec" (operations per second). As the packets are very small, it puts aside the time spent copying payload and is basically testing how many packets per second the system can handle if it weren’t for that. Again, as with the previous test, the test was limited by the application CPU only, be it sender or receiver. See Figures 7-9 and their respective tables.
                DUT rcv
                    CPU App %usr     15.6+-0.6
                    CPU App %sys     84.3+-0.6
                    CPU App %irq     0.0+-0.0
                    CPU App %soft    0.0+-0.0
                    CPU App %idle    0.0+-0.0
                    CPU S-IRQ %usr   0.1+-0.4
                    CPU S-IRQ %sys   0.1+-0.3
                    CPU S-IRQ %irq   0.0+-0.0
                    CPU S-IRQ %soft  23.6+-2.1
                    CPU S-IRQ %idle  76.2+-2.4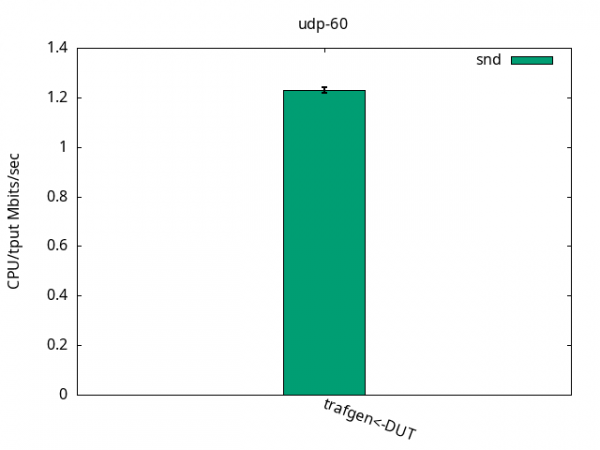
                DUT snd
                    CPU App %usr     8.1+-0.6
                    CPU App %sys     91.9+-0.6
                    CPU App %irq     0.0+-0.0
                    CPU App %soft    0.0+-0.0
                    CPU App %idle    0.1+-0.0
                    CPU S-IRQ %usr   0.0+-0.0
                    CPU S-IRQ %sys   0.2+-0.4
                    CPU S-IRQ %irq   0.0+-0.0
                    CPU S-IRQ %soft  24.3+-1.0
                    CPU S-IRQ %idle  75.5+-1.2
Tests with Red Hat Enterprise Linux 9.4
Red Hat Enterprise Linux 9.4 kernel is kernel-5.14.0-427.el9 and that’s what we tested here, with the same procedure as above.
TCP throughput
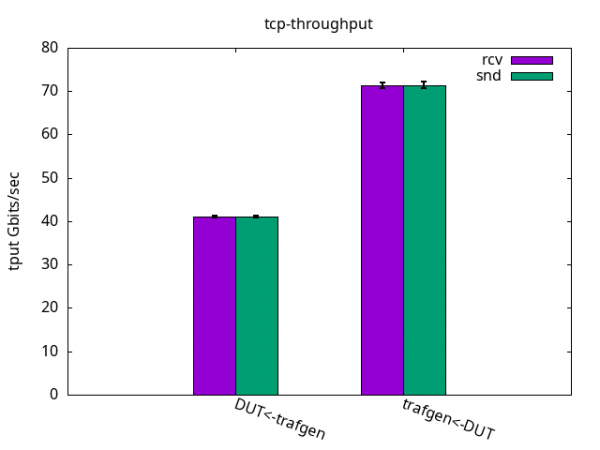
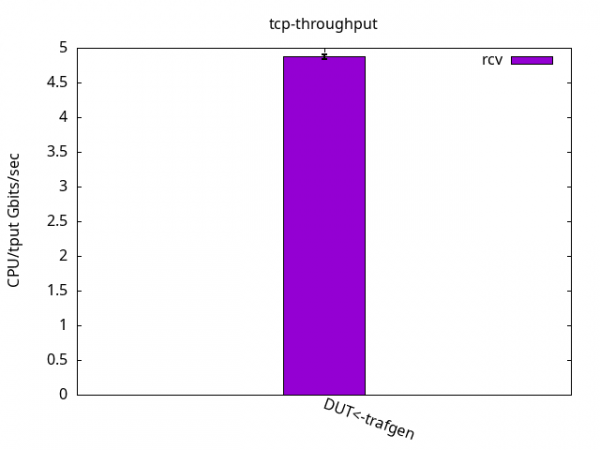
Similarly to the ELN kernel, throughput was limited by the receiver CPUs. The DUT was able to send 71.44+-0.73Gbps and to receive 41.02+-0.25Gbps, as you can see in Figure 10. While sending it was similar to ELN kernel but when receiving, it was 17% faster. The CPU usage is detailed on Figures 11 and 12 and their respective tables.
                DUT rcv
                    CPU App %usr     0.9+-0.1
                    CPU App %sys     99.0+-0.1
                    CPU App %irq     0.0+-0.0
                    CPU App %soft    0.0+-0.0
                    CPU App %idle    0.1+-0.1
                    CPU S-IRQ %usr   0.0+-0.0
                    CPU S-IRQ %sys   0.1+-0.0
                    CPU S-IRQ %irq   0.0+-0.0
                    CPU S-IRQ %soft  99.9+-0.1
                    CPU S-IRQ %idle  0.0+-0.0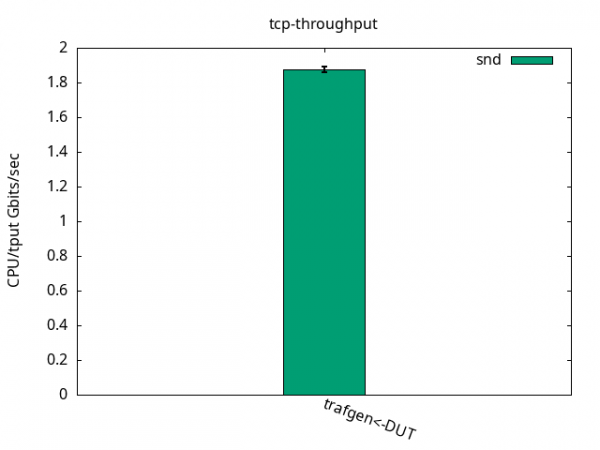
                DUT snd
                    CPU App %usr     0.9+-0.1
                    CPU App %sys     92.9+-0.9
                    CPU App %irq     0.0+-0.0
                    CPU App %soft    0.0+-0.0
                    CPU App %idle    6.1+-0.8
                    CPU S-IRQ %usr   0.0+-0.0
                    CPU S-IRQ %sys   0.0+-0.0
                    CPU S-IRQ %irq   0.0+-0.0
                    CPU S-IRQ %soft  40.3+-0.4
                    CPU S-IRQ %idle  59.7+-0.4
UDP 1500 bytes
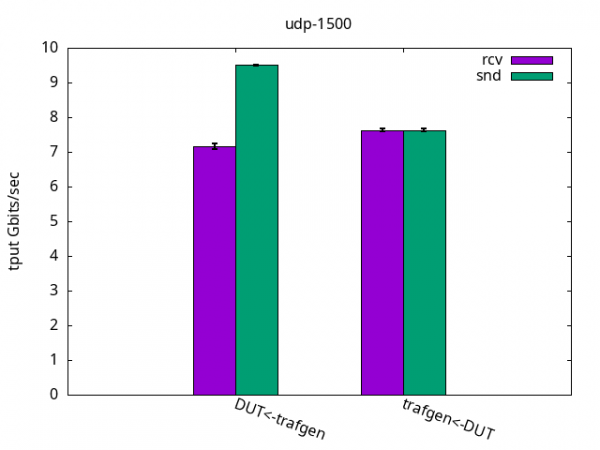
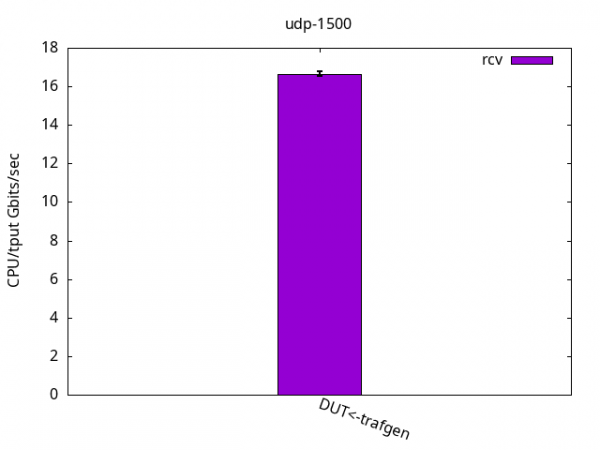
The results shown in Figure 13 below, compared to the ELN kernel, were close and the same limiting factors applied. That is, the application CPU was the bottleneck of the test, and is detailed on Figures 14 and 15 and their respective tables.
                DUT rcv
                    CPU App %usr     12.4+-0.4
                    CPU App %sys     87.6+-0.4
                    CPU App %irq     0.0+-0.0
                    CPU App %soft    0.0+-0.0
                    CPU App %idle    0.0+-0.0
                    CPU S-IRQ %usr   0.0+-0.0
                    CPU S-IRQ %sys   0.0+-0.0
                    CPU S-IRQ %irq   0.0+-0.0
                    CPU S-IRQ %soft  23.8+-1.3
                    CPU S-IRQ %idle  76.2+-1.3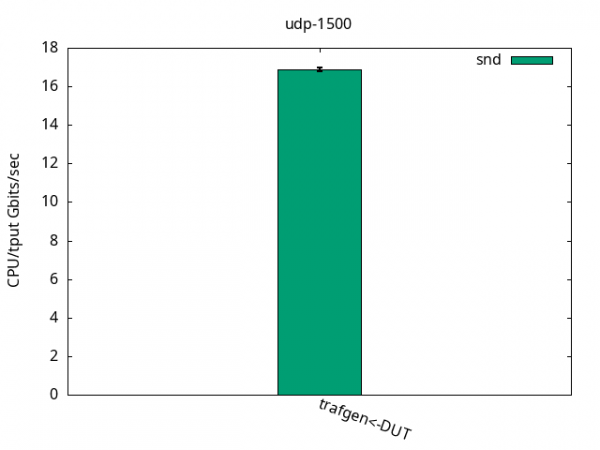
                DUT snd
                    CPU App %usr     7.0+-0.4
                    CPU App %sys     92.9+-0.4
                    CPU App %irq     0.0+-0.0
                    CPU App %soft    0.0+-0.0
                    CPU App %idle    0.1+-0.0
                    CPU S-IRQ %usr   0.0+-0.0
                    CPU S-IRQ %sys   0.0+-0.0
                    CPU S-IRQ %irq   0.0+-0.0
                    CPU S-IRQ %soft  24.4+-0.4
                    CPU S-IRQ %idle  75.6+-0.4
UDP 60 bytes
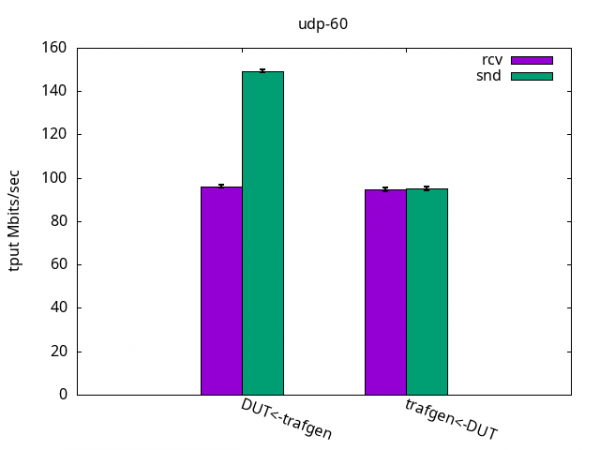
The throughput results, with a consistent 95Mbps for send and also receive, is shown in Figure 16. Once again, the application CPU was the bottleneck for the test, while leaving plenty of %idle CPU time on the IRQ CPU, and is detailed on Figures 17 and 18 and their respective tables.
                DUT rcv
                    CPU App %usr     13.2+-0.4
                    CPU App %sys     86.7+-0.4
                    CPU App %irq     0.0+-0.0
                    CPU App %soft    0.0+-0.0
                    CPU App %idle    0.1+-0.0
                    CPU S-IRQ %usr   0.0+-0.0
                    CPU S-IRQ %sys   0.0+-0.0
                    CPU S-IRQ %irq   0.0+-0.0
                    CPU S-IRQ %soft  21.2+-0.6
                    CPU S-IRQ %idle  78.8+-0.6
                DUT snd
                    CPU App %usr     7.2+-0.3
                    CPU App %sys     92.8+-0.3
                    CPU App %irq     0.0+-0.0
                    CPU App %soft    0.0+-0.0
                    CPU App %idle    0.1+-0.0
                    CPU S-IRQ %usr   0.0+-0.0
                    CPU S-IRQ %sys   0.0+-0.0
                    CPU S-IRQ %irq   0.0+-0.0
                    CPU S-IRQ %soft  21.8+-0.9
                    CPU S-IRQ %idle  78.2+-0.9
Conclusions
With all the results above, it is clear that the bandwidth handled by a single core on the DUT server is very capable of sustaining real and updated networking workloads while still having a considerable processing power left unused on the chip.
It is worth mentioning that the DUT server was launched mid-2020 and that aarch64 designs often have plenty of cores which the applications can use to scale.
Please don’t hesitate to reach out in case you are interested in more details!
