Most of the time, when we think about collecting, parsing and storing Logs, the first thing that pops in our mind is the ElasticStack or ELK. It is well positioned in developer and sysadmin's minds. The stack combines the popular Elasticsearch, Logstash and Kibana projects together to easy the collection/aggregation, store, and visualization of application logs. As an Apache Camel rider and Infinispan enthusiast, I prepared this exercise to produce my own log collector and store stack using Red Hat's products, JBoss Fuse and JBoss Data Grid, instead.
What are JBoss Fuse and JBoss Data Grid?
Design
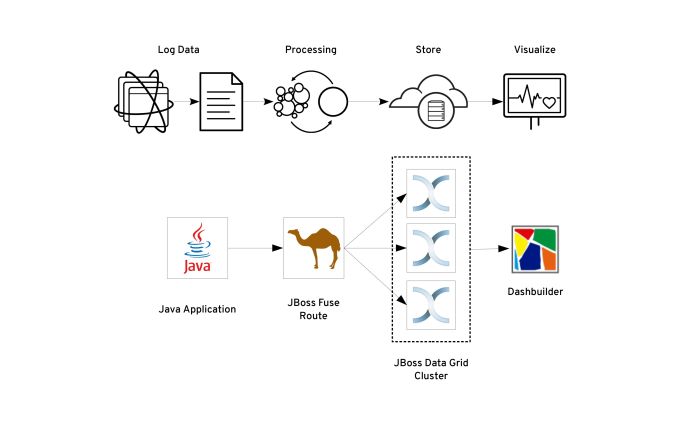
For the purpose of this post, I collect the log data generated by the JBoss Data Grid Server. The solution reads the server.log file generated by the server, parse every log line using regular expressions and marshall it to JSON. Then, each message will be inserted and indexed in the data grid.

Out of the scope of this post is the visualization part of the project. You can try Red Hat JBoss Data Virtualization that has a native connector to the JBoss Data Grid cluster. The visualization tools are based on the Dashbuilder community project. For this example, I query the data using the embedded REST API from the JBoss Data Grid Server.
Setting up the environment
I will assume you are familiar with Java EE and Spring Development, and you have set up your development IDE. If you haven't done the latter, you can check Red Hat Developers' Blog on how to set up and configure the Red Hat JBoss Developer Studio.
You will also need to download the JBoss Data Grid Server from the Red Hat Developers (link) or Customer Portal (if you are a Red Hat's customer) to configure it in the client-server mode.
If you're too eager to read the whole post, you can check out the complete code from GitHub https://github.com/hguerrero/fuse-examples/logging-collector.
The Log Collector
I used the latest version of Apache Camel bundled with version 6.3.0 of JBoss Fuse maven Bill of Materials (BOM). You can check a snippet of the project's pom.xml file with the required versions for this project.
<properties>
     <camel.version>2.17.0.redhat-630224</camel.version>
     <jboss.fuse.bom.version>6.3.0.redhat-224</jboss.fuse.bom.version>
     <jboss.datagrid.version>6.6.1.Final-redhat-1</jboss.datagrid.version>
 </properties>

 <dependencyManagement>
     <dependencies>
         <dependency>
             <groupId>org.jboss.fuse.bom</groupId>
             <artifactId>jboss-fuse-parent</artifactId>
             <version>${jboss.fuse.bom.version}</version>
             <type>pom</type>
             <scope>import</scope>
         </dependency>
     </dependencies>
 </dependencyManagement>
You can use the maven archetype included in JBoss Developer Studio to get a spring-based project or start with a blank one.
For the log collector, I use the Stream component that allows us to get interact with streams like System.in/System.out or files. I'm not using the File component, as I wanted to keep the stream open waiting for new data, resembling the Linux tail command. You need to add the dependency for the camel-stream component.
<dependency>
     <groupId>org.apache.camel</groupId>
     <artifactId>camel-stream</artifactId>
 </dependency>
The log collector consists of a Camel Route that has the stream component as a file consumer with the scanStream flag set to true. Each line written to the file becomes a message.
<from uri="stream:file?fileName=/opt/jboss-datagrid-6.6/standalone/log/server.log&scanStream=true"/>
package mx.redhat.demo.fuse;

import java.text.DateFormat;
import java.text.SimpleDateFormat;
import java.util.Date;
import java.util.HashMap;
import java.util.Map;
import java.util.regex.Matcher;
import java.util.regex.Pattern;

import org.apache.camel.Exchange;
import org.apache.camel.Processor;
import org.slf4j.Logger;
import org.slf4j.LoggerFactory;

public class JBossEAPLogParser implements Processor
{
    private Logger log = LoggerFactory.getLogger(JBossEAPLogParser.class);
    private String pattern = "(?.{12}+) (?.{5}+) \\[(?.+)\\] \\((?[^\\)]+)\\) (?.+)";
    private Pattern compile = Pattern.compile(pattern);
    private String[] tokens = { "time", "level", "class", "thread", "message"};
    private DateFormat formatter = new SimpleDateFormat("yyyy-MM-dd'T'HH:mm:ss.SSSZ");

    @Override
    public void process(Exchange exchange) throws Exception
    {
        String payload = exchange.getIn().getBody(String.class);
        log.trace("Processing payload: %s", payload);
        Map<String, String> map = processMessage(payload);
        map.put("message", payload);
        map.put("@timestamp", formatter.format(new Date()));
        exchange.getOut().setBody(map);
    }

    public Map<String, String> processMessage(String data)
    {
        Map<String, String> map = new HashMap<String, String>();
        Matcher matcher = compile.matcher(data);
        if(matcher.find())
        {
            for(String token : tokens)
            {
                String myNamedGroup= matcher.group(token);
                log.trace("Token %s group: %s \n", token, myNamedGroup);
                map.put(token, matcher.group(token));
            }
        }
        return map;
    }
}
The processing of the messages adds a timestamp and more context data like log level, class, thread. It can eventually add more options as hostname or server name.
The result of the previous step is a map that we now marshall using the Jackson library to produce the JSON object (link). Don't forget to add maven dependency.
<dependency>
     <groupId>org.apache.camel</groupId>
     <artifactId>camel-jackson</artifactId>
 </dependency>
This is how the route looks like:
<route>
     <from uri="stream:file?fileName=/opt/jboss-datagrid-6.6/standalone/log/server.log&scanStream=true"/>
     <bean beanType="mx.redhat.demo.fuse.JBossEAPLogParser"/>
     <marshal>
         <json library="Jackson"/>
     </marshal>
     <to uri="direct:infinispan"/>
</route>
The route then forwards the message to the 'infinispan' route that will insert the payload as String in the data grid using the camel-jbossdatagrid component.
Storing the logs
There are two main configurations for the data grid. You can use it in the Library mode, where the engine is embedded in the same JVM and the same heap is used to store the data. The second option available is the Client-Server mode. It is built on top of JBoss EAP and, in this configuration; the engine and the data live on a separate JVM from the application JVM.
In this blog, Client-Server mode configuration will be used to get a cluster that scales horizontally and independent from the route. If you haven't set up the JBoss Data Grid Server, you can follow the Red Hat Developers' blog post. For this specific use case, JBoss Data Grid Server version 6 will be enough.
Before starting the JBoss Data Grid Server cluster, it's recommended to configure a specific cache to store the data logs. Enabling compatibility mode let us query the stored data using the REST API from any browser or REST client like curl.
To add the cache configuration, you need to edit the clustered.xml file located under $JDG_HOME/standalone/configuration path. Under the infinispan subsystem, add the cache configuration lines after the default cache configuration.
<subsystem xmlns="urn:infinispan:server:core:6.4" default-cache-container="clustered">
    <cache-container name="clustered" default-cache="default" statistics="true">
    ...
        <distributed-cache name="logs" mode="ASYNC" segments="20" owners="2" remote-timeout="30000" start="EAGER">
            <locking acquire-timeout="30000" concurrency-level="1000" striping="false"/>
            <transaction mode="NONE"/>
            <compatibility enabled="true"/>
        </distributed-cache>
        ...
</subsystem>
The above configuration enables an asynchronously distributed cache (you can check more about clustered modes in this link) named logs. You can check the specifics of the configuration in the official JBoss Data Grid documentation available on the Red Hat portal.
One of the most interesting features of the client-server mode where using is the embedded REST API to put and retrieve the stored data. It opens the possibility to use any client disregarding of the development language if that client supports HTTP communication. The data grid server also includes its own tcp binary client protocol to connect to the grid. It's called Hot Rod and is the implementation used for the camel-datagrid component. When the compatibility flag is enabled, you can put and retrieve data seamlessly with either API.
To add the camel-jbossdatagrid component you need to add the maven dependency and specify the JBoss Data Grid version used.
<dependency>
   <groupId>org.apache.camel</groupId>
   <artifactId>camel-jbossdatagrid</artifactId>
   <version>${jboss.datagrid.version}</version>
</dependency>
The use of the camel-jbossdatagrid component is quite easy. You only need to configure the key and value as message headers. Then, invoke the producer with the hostname:port of any node of the data grid cluster and the desired cache to store the data.
For this example, we will use the Camel message ID as a key and the message payload (as string) for the value. The cache used is the previously configured logs cache.
<route>
     <from uri="direct:infinispan"/>
     <setHeader headerName="CamelInfinispanKey">
         <simple>${id}</simple>
     </setHeader>
     <setHeader headerName="CamelInfinispanValue">
         <simple>${bodyAs(String)}</simple>
     </setHeader>
     <to uri="infinispan://localhost?cacheName=logs"/>
 </route>
With this second route, the project is ready to run and start collecting the data grid server logs.
Running the project
The first thing to do is start the data grid cluster. From the command line start the clustered version of the server specifying the ports and the node names so there are no troubles running the cluster on the same machine.
Run node1 with the port-offset 0:
$ ${JDG_HOME}/bin/clustered -Djboss.socket.binding.port-offset=0 -Djboss.node.name=node1
Run node2 with the port-offset 1:
$ ${JDG_HOME}/bin/clustered -Djboss.socket.binding.port-offset=1 -Djboss.node.name=node2
Run node3 with the port-offset 2:
$ ${JDG_HOME}/bin/clustered -Djboss.socket.binding.port-offset=2 -Djboss.node.name=node3
Note: remember to open the udp/tcp ports in your test machine so the nodes are able to join the cluster.
After starting the data grid cluster you can start the camel route using the camel-maven-plugin. Add the following lines to enable it under the plugins section. If you created the project from the maven archetype, it will probably be already there. Don't forget to specify the same version you're using of Apache Camel.
<plugin>
    <groupId>org.apache.camel</groupId>
    <artifactId>camel-maven-plugin</artifactId>
    <version>${camel.version}</version>
    <configuration>
    <fileApplicationContextUri>src/main/resources/META-INF/spring/camel-context.xml</fileApplicationContextUri>
    </configuration>
</plugin>
This plugin enables the project to run the route as a simple Java application without the need to deploy the bundle to a Java container. In this way, you can run Apache Camel routes from the command line with this command:
$ mvn clean camel:run
The above command will start the Camel Context and Route to scan the data grid server log file line by line putting the parsed message in the data grid cache. If you check carefully the display log, you will notice that even tough only the first node of the cluster is configured to the route, the Hot Rod protocol receives the cluster topology adding the other two nodes to the client pool.
...

INFO Refreshing org.springframework.context.support.FileSystemXmlApplicationContext@67692d1f: startup date [Tue Feb 28 13:19:23 CST 2017]; root of context hierarchy

INFO Loading XML bean definitions from file [/home/hguerrer/git/fuse-examples/logging-collector/src/main/resources/META-INF/spring/camel-context.xml]

INFO Pre-instantiating singletons in org.springframework.beans.factory.support.DefaultListableBeanFactory@2edb5eba: defining beans [template,consumerTemplate,camel-1:beanPostProcessor,camel-1]; root of factory hierarchy

INFO Apache Camel 2.17.0.redhat-630224 (CamelContext: camel-1) is starting

INFO JMX is enabled

INFO Loaded 183 type converters

INFO Runtime endpoint registry is in extended mode gathering usage statistics of all incoming and outgoing endpoints (cache limit: 1000)

INFO AllowUseOriginalMessage is enabled. If access to the original message is not needed, then its recommended to turn this option off as it may improve performance.

INFO StreamCaching is not in use. If using streams then its recommended to enable stream caching. See more details at http://camel.apache.org/stream-caching.html

INFO ISPN004006: localhost/127.0.0.1:11222 sent new topology view (id=4, age=0) containing 3 addresses: [/127.0.0.1:11222, /127.0.0.1:11223, /127.0.0.1:11224]

INFO ISPN004014: New server added(/127.0.0.1:11223), adding to the pool.

INFO ISPN004014: New server added(/127.0.0.1:11224), adding to the pool.

INFO ISPN004021: Infinispan version: 6.4.1.Final-redhat-1

INFO Route: route1 started and consuming from: Endpoint[stream://file?fileName=%2Fopt%2FNotBackedUp%2Fjboss-datagrid-6.6.0-server%2Fstandalone%2Flog%2Fserver.log&scanStream=true]

INFO Route: route2 started and consuming from: Endpoint[direct://infinispan]

INFO Total 2 routes, of which 2 are started.

INFO Apache Camel 2.17.0.redhat-630224 (CamelContext: camel-1) started in 1.259 seconds

INFO ISPN004006: /127.0.0.1:11223 sent new topology view (id=4, age=0) containing 3 addresses: [/127.0.0.1:11222, /127.0.0.1:11223, /127.0.0.1:11224]
Because the route uses the Stream component, it will keep running waiting for more input data from the specified file. If you want to stop the route just press CTRL+C.
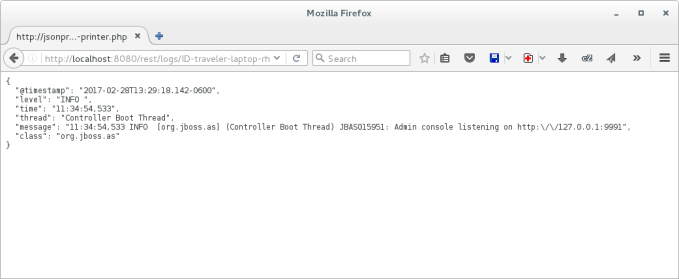
The easiest way to check that everything ran fine and logs were collected is querying the data grid REST API. You only need to open the following URL on your browser or REST client.
http://localhost:8080/rest/logs/
Note: Don't forget to create a user with the correct REST roles so you can authenticate with the server. Disabling security is not recommended.
You will get a list of the linked keys to the messages stored in the server. Depending on the log size, it could take a while to load the page.

If you click on any of the links, you will be able to inspect the JSON data.

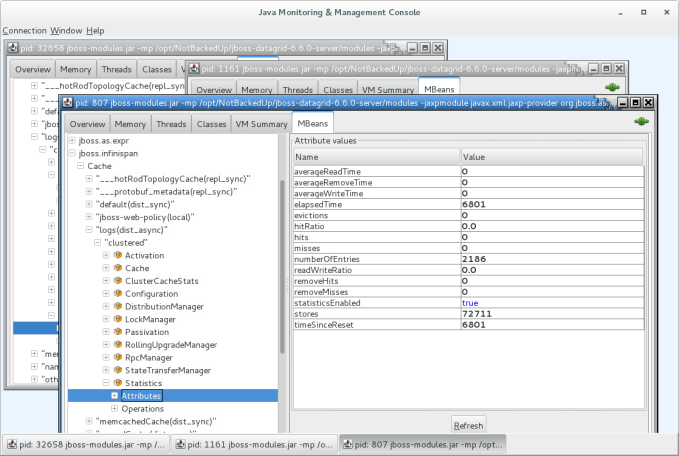
If you want to check more information of the data grid server, you can use the Java Monitoring and Management Console (JConsole) to inspect the exposed MBeans on any of the nodes. Statistics are enabled by default.

Some of the statistics you can browse are numberOfEntries and stores. The first refers to the number of entries in the cache and the latter the total number of put operations. You can check other metrics exposed in the MBeans here. Each entry represents a parsed log message.
The data collected is kept in the data grid cluster rebalancing the entries automatically when a node goes down until all the nodes are taken down. You can configure the cache to store the memory content in a database of the filesystem in case of a full cluster restart.
Next Steps
Even though it's not complete; you can check the versatility of the solutions to solve this simple task. On following posts, I will try to complete the full process adding the visualization tools needed to query and search the data stored in the grid. One way to go is using JBoss Data Virtualization to do a remote query on the grid and present the data using the included dashboard. The long way is to try the OData wrapper for JBoss Data Grid Library mode and create an OData provider for Dashbuilder. Stay tuned for the follow-up.
Summary
JBoss Fuse and JBoss Data Grid are two powerful products based on popular community projects that can be used to collect, parse and store application logs. You can use your Apache Camel knowledge to increase the use cases of the framework. The 160+ included JBoss Fuse components plus the blueprint/spring DSL; simplify the integration tasks with an almost zero code development.
If you want the full detail, you can check out the complete code developed before from my GitHub repo https://github.com/hguerrero/fuse-examples/logging-collector.
Click here to for an overview of Red Hat JBoss Fuse a lightweight and modular integration platform.
Last updated: March 22, 2023