Visual Studio provides a graphical remote debugging ASP.NET Core app with Docker Tools for Windows. Since Visual Studio supports SSH protocol, you can remote debug ASP.NET Core process running on the Linux host. It used to be if you install and setup SSH server on docker container, you can remote debug with Visual Studio. However, it's strongly not recommended due to security reasons. Now I'll explain to you how to remote debug your ASP.NET Core on OpenShift with Visual Studio Code by using oc exec command instead of installing SSH server on docker container. You can use Microsoft proprietary debugger engine vsdbg with Visual Studio Code (or other Visual Studio products). Visual Studio Code can integrate other commands than SSH for debugger transport protocol.
Install and set up vsdbg on docker container
To follow the steps below, you may have to deploy ASP.NET Core app on OpenShift. If you haven't done so, you can use the example project. I will use this project as an example. Once the application pod runs, you'll install vsdbg on this pod. The dotnet image version 2.0-7 or later has an unzip command, you can install vsdbg with the steps below.
$ export POD_NAME=<pod_name>
$ oc rsh $POD_NAME
sh-4.2$  curl -sSL https://aka.ms/getvsdbgsh | bash /dev/stdin -v latest -l /opt/app-root/vsdbg -r linux-x64
Info: Creating install directory
Using arguments
    Version                    : 'latest'
    Location                   : '/opt/app-root/vsdbg'
    SkipDownloads              : 'false'
    LaunchVsDbgAfter           : 'false'
    RemoveExistingOnUpgrade    : 'false'
Info: Using vsdbg version '15.1.10630.1'
Info: Previous installation at /opt/app-root/vsdbg not found
Info: Using Runtime ID 'linux-x64'
Downloading https://vsdebugger.azureedge.net/vsdbg-15-1-10630-1/vsdbg-linux-x64.zip
Info: Successfully installed vsdbg at '/opt/app-root/vsdbg'
If you use an older version of a dotnet image, an alternative way is installing vsdbg on your local machine and transferring them.
$ export POD_NAME=<pod_name>
$ curl -sSL https://aka.ms/getvsdbgsh | bash /dev/stdin -v latest -l ./vsdbg -r linux-x64
$ oc rsync ./vsdbg $POD_NAME:/opt/app-root/app/
The PID of a dotnet process is also required. It's usually 1, but confirm with the command below, just in case.
$ oc exec $POD_NAME -- ps aux
USER        PID %CPU %MEM    VSZ   RSS TTY      STAT START   TIME COMMAND
default       1  0.0  0.5 21251236 75376 ?      SLsl Sep29   0:24 dotnet app.dll
default      48  0.0  0.0  17748  2016 ?        Ss+  Sep29   0:00 /bin/sh
default   25663  0.0  0.0  53424  1936 ?        Rs   05:47   0:00 ps aux
Now the pod is ready to debug.
Set up your local machine
You should have the same code as the one deployed. If you use the dotnet example app, clone the code and checkout dotnetcore-2.0 branch.
$ git clone https://github.com/redhat-developer/s2i-dotnetcore-ex.git
$ cd s2i-dotnetcore-ex
$ git checkout dotnetcore-2.0
Now open the project with Visual Studio code.
$ code appThen open a .vscode/launch.json file or create it if it hasn't been created. Then add the below json as an element of the configuration array.
{
            "name": ".NET Core OpenShift Pod Remote Attach",
            "type": "coreclr",
            "request": "attach",
            "processId": "",
            "pipeTransport": {
                "pipeProgram": "oc",
                "pipeArgs": [ "exec", "-it", "<pod_name>", "--"],
                "quoteArgs":false,
                "debuggerPath": "/opt/app-root/vsdbg/vsdbg",
                "pipeCwd": "${workspaceRoot}"
            },
            "justMyCode":false,
            "sourceFileMap": { "/opt/app-root/src": "${workspaceRoot}"}
        }
Visual Studio Code will launch the process specified by pipeProgram and pipeArgs as transferring remote debug commands. debuggerPath is a full path of vsdbg. If you install at another location, it should be changed. If your application builds with the Release configuration, which is a default for s2i-dotnetcore, justMyCode should be false. Since the s2i-dotnetcore builds your source located at /opt/app-root/src, you should specify this path at sourceFileMap. Please note this is a path where your project is located when it's built. If you build and deploy by .NET Core Runtime image, the application code has no source code. However, remote debug will work if you specify the sourceFileMap as above.
Now ready for remote debugging.
Start remote debugging
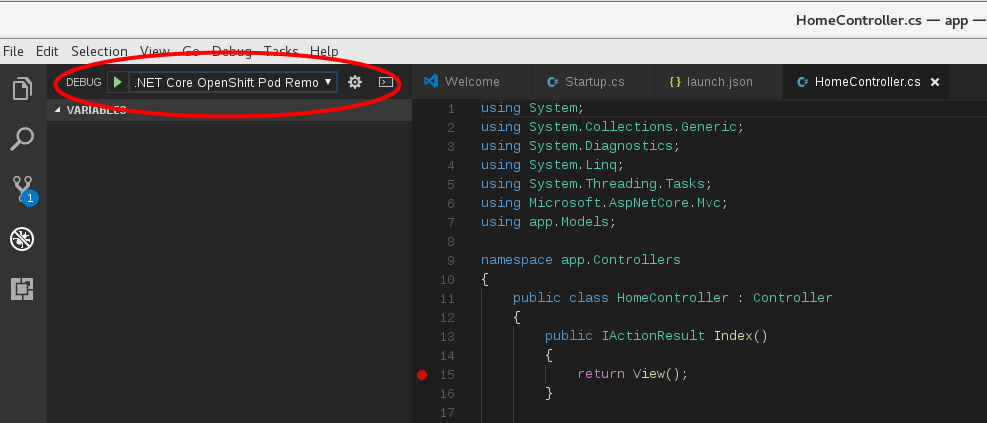
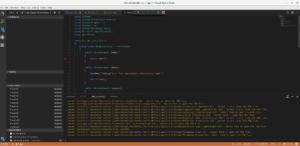
You can start remote debug by selecting .NET Core OpenShift Pod Remote Attach in the debug menu and click the debug start menu or F5 key. You'll find log messages and remote debug icons once it's connected.

Let's put in a breakpoint. Contoller/HomeContoller.cs is easy to test.

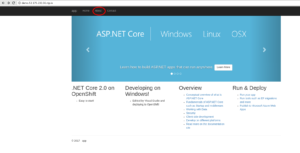
When you're accessing the about page,

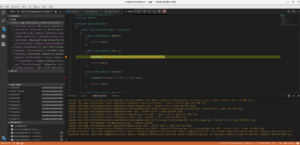
the debugger stops at the beak point.

You can see the local variables and stack trace, set endpoint and so on. Let's enjoy remote debugging!
Last updated: September 3, 2019