In the previous article, Linux on Arm (aarch64) servers..., we examined flat networks. That is, we used only bare network interfaces and nothing else. That's a good start, but it is often not the topology used, especially with solutions like OpenStack. So in this installment, let’s evaluate how impactful VXLAN encapsulation can be for throughput and CPU consumption.
We’ll reuse the hosts and testing procedures, with only the modifications to add VXLAN. For details on the test environment, please refer to the previously mentioned article.
VXLAN configuration
Each host has a VXLAN tunnel to the other host. For reference, the following is the NMState YAML file used for one of the hosts:
interfaces:
- name: vxlan08-09
  type: vxlan
  state: up
  mtu: 1450
  ipv4:
    address:
    - ip: 192.168.2.1
      prefix-length: 24
    enabled: true
    dhcp: false
  vxlan:
    base-iface: enp1s0f0np0
    id: 809
    remote: 192.168.1.2
routes:
  config:
    - destination: 192.168.2.2/32
      next-hop-interface: vxlan08-09
Tests with ELN kernal
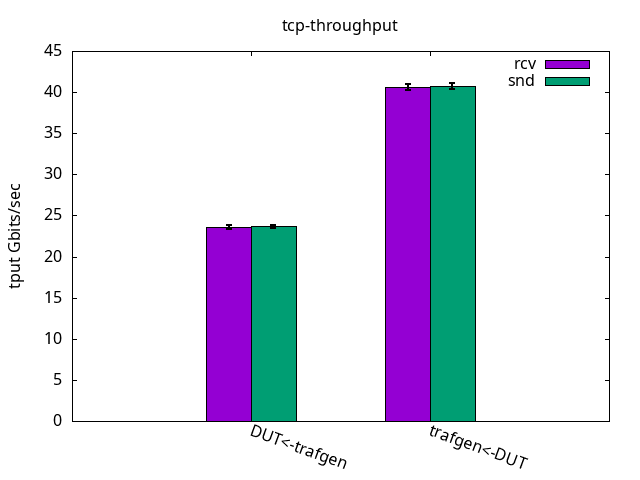
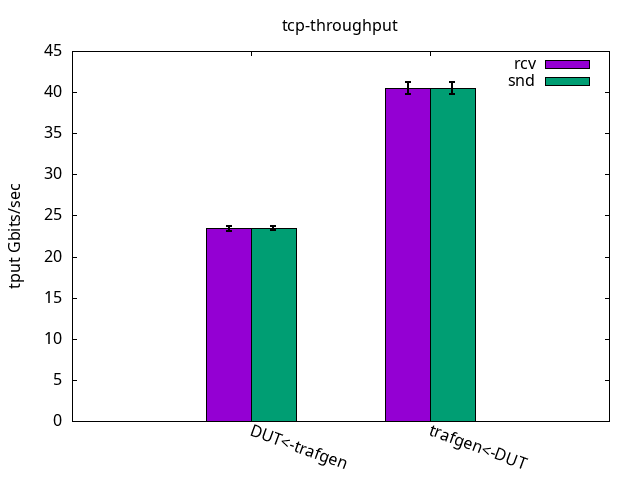
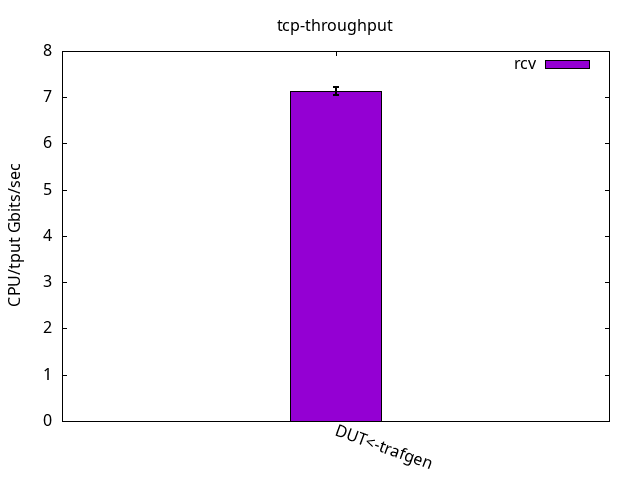
With an ELN kernel, kernel-6.9.0-0.rc4.37.eln136, the results are shown in Figure 1. Each pair of bars is a test. For example, the first pair, the generated traffic is in green while the received traffic by the device under test (DUT) is in purple. For transmission control protocol (TCP), they are the same, but they will vary on user datagram protocol (UDP) tests. The error markers are standard deviation out of 10 runs of 1 minute.
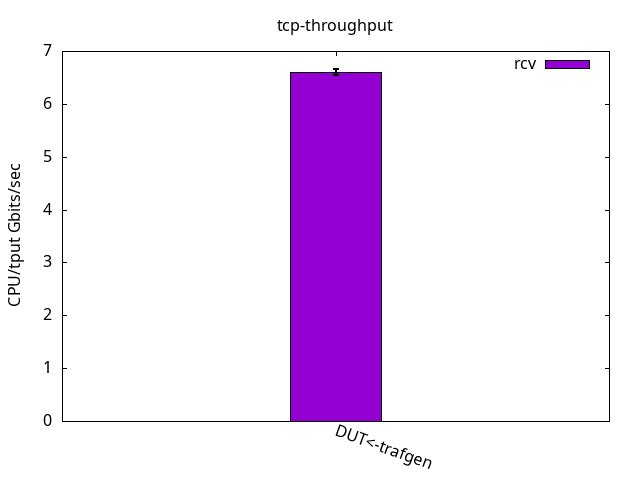
For the CPU/throughput graphs, the total CPU consumption for both cores, application, and interrupt request (IRQ) are summed (theoretical maximum of 200 then) and then divided by the observed throughput. The smaller the number, the better (less CPU used to pump the same amount of traffic).
TCP throughput: Figure 1 shows that encapsulation adds a toll. We can see it when compared to the results in previous article. It goes about 60% of the original throughput.
The application CPU, which was just 11.1% free, now gets some more slack because the IRQ one needs to do more work for the same packet, as seen in Figures 2 and 3 and their respective tables. Like before, what limits the throughput is the receiver IRQ CPU usage in all cases. Similar to the test with bare interfaces, it’s interesting to note that DUT was able to send traffic as fast as the traffic generator could receive while still having nearly half of the CPU power left unused.
                 DUT rcv
CPU App %usr     1.8+-0.3
CPU App %sys     54.2+-0.6
CPU App %irq     0.0+-0.0
CPU App %soft    0.0+-0.0
CPU App %idle    44.0+-0.5
CPU S-IRQ %usr   0.0+-0.0
CPU S-IRQ %sys   0.0+-0.0
CPU S-IRQ %irq   0.0+-0.0
CPU S-IRQ %soft  99.9+-0.1
CPU S-IRQ %idle  0.1+-0.0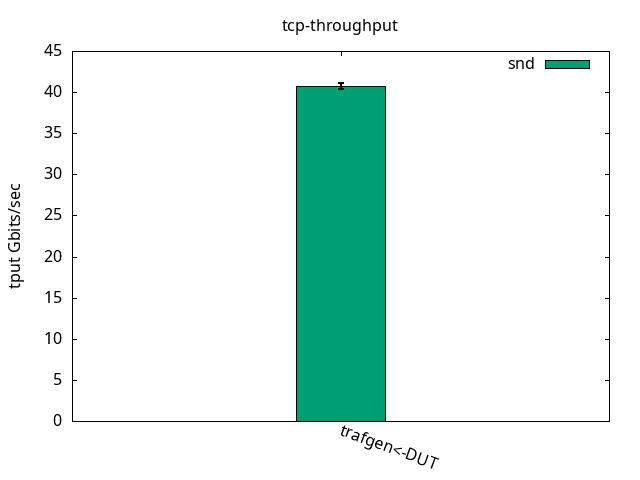
                 DUT snd
CPU App %usr     0.7+-0.1
CPU App %sys     56.0+-1.1
CPU App %irq     0.0+-0.0
CPU App %soft    0.0+-0.0
CPU App %idle    43.3+-1.0
CPU S-IRQ %usr   0.0+-0.0
CPU S-IRQ %sys   0.1+-0.3
CPU S-IRQ %irq   0.0+-0.0
CPU S-IRQ %soft  53.1+-0.6
CPU S-IRQ %idle  46.8+-0.6
UDP 1500 bytes
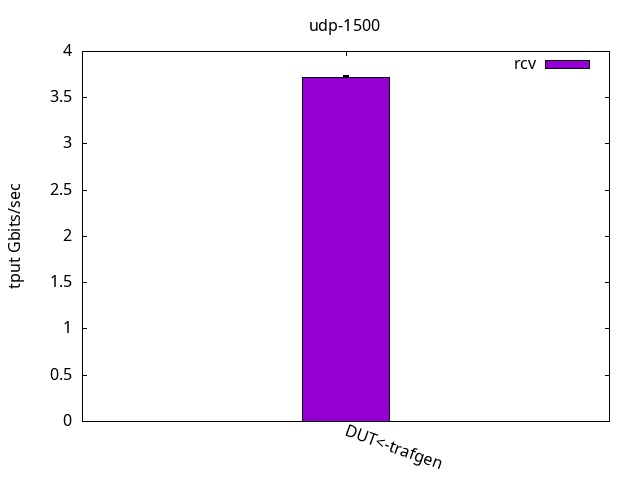
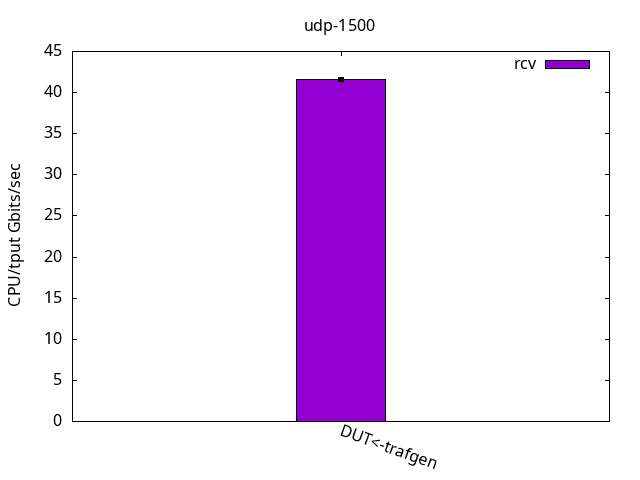
Figure 4 shows that the throughput is halved compared to the test with bare interfaces, which is expected for this topology.
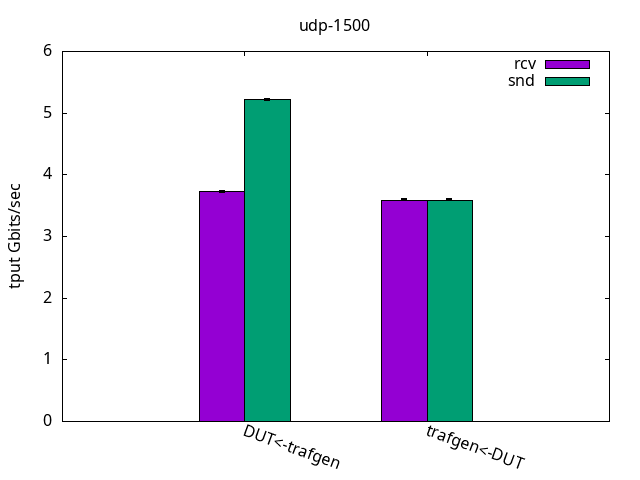
We can observe that the CPU usage pattern on the sending side is similar to the bare interface test with the application CPU being the bottleneck. As seen in Figures 5 and 6 and their respective tables, most of the VXLAN transmit processing is done at the application CPU, while the IRQ CPU is only doing the transmit completion. This means just freeing the sent packets, so it puts a considerable pressure on the sending application CPU. Conversely, on the receiving side, the DUT IRQ CPU gets fully busy, causing 42% idle time to show up now in the DUT application CPU.
                 DUT rcv
CPU App %usr     6.9+-0.2
CPU App %sys     50.9+-0.4
CPU App %irq     0.0+-0.0
CPU App %soft    0.0+-0.0
CPU App %idle    42.2+-0.4
CPU S-IRQ %usr   0.0+-0.0
CPU S-IRQ %sys   0.0+-0.0
CPU S-IRQ %irq   0.0+-0.0
CPU S-IRQ %soft  99.9+-0.0
CPU S-IRQ %idle 0.0+-0.0 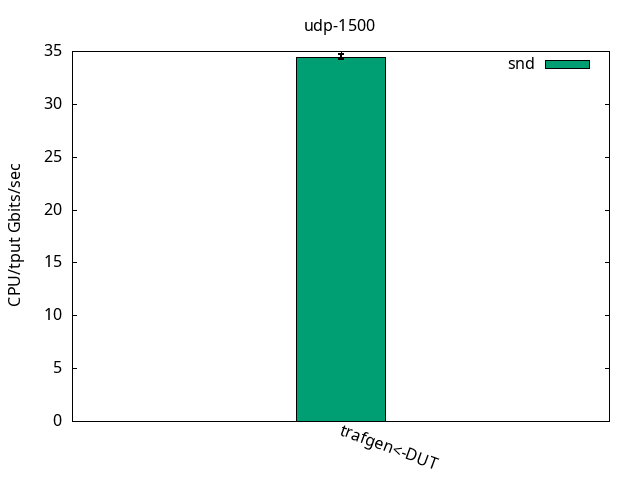
                 DUT snd
CPU App %usr     4.2+-0.4
CPU App %sys     95.7+-0.4
CPU App %irq     0.0+-0.0
CPU App %soft    0.0+-0.0
CPU App %idle    0.1+-0.0
CPU S-IRQ %usr   0.1+-0.2
CPU S-IRQ %sys   0.0+-0.0
CPU S-IRQ %irq   0.0+-0.0
CPU S-IRQ %soft  23.7+-0.9
CPU S-IRQ %idle  76.2+-1.0
UDP 60 bytes
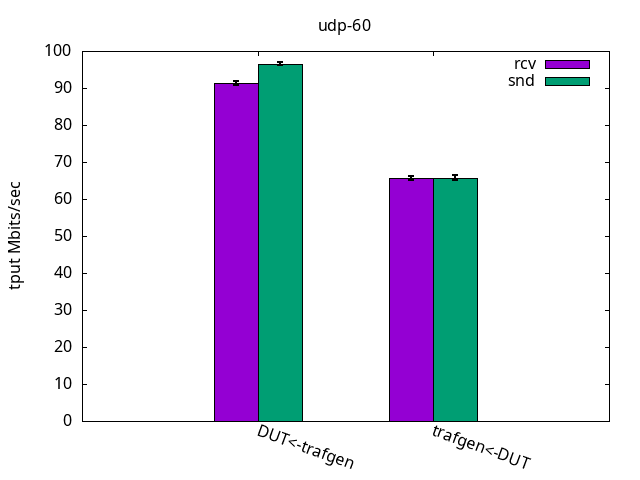
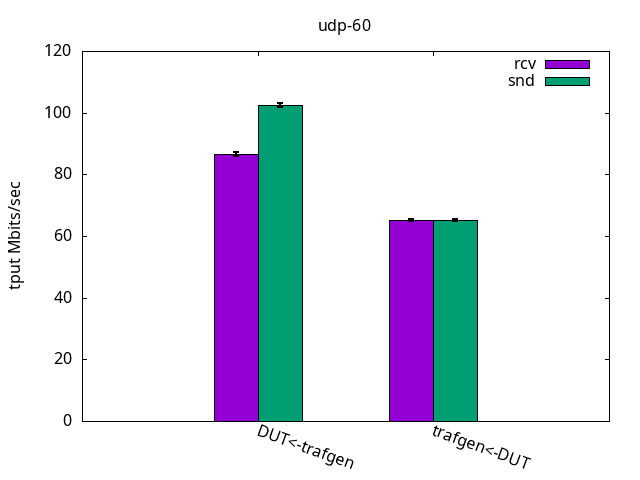
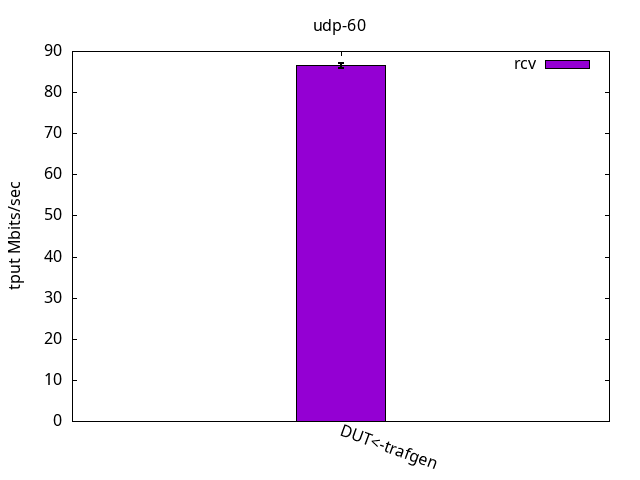
In this test, the encapsulation toll is less expressive because the stack is already under pressure due to the small packet size. The increased overhead due to the VXLAN processing is not as expressive as in the previous test, as seen in Figures 7-9 and their respective tables.

                 DUT rcv
CPU App %usr     15.0+-0.5
CPU App %sys     85.0+-0.5
CPU App %irq     0.0+-0.0
CPU App %soft    0.0+-0.0
CPU App %idle    0.0+-0.0
CPU S-IRQ %usr   0.0+-0.0
CPU S-IRQ %sys   0.0+-0.0
CPU S-IRQ %irq   0.0+-0.0
CPU S-IRQ %soft  58.9+-1.5
CPU S-IRQ %idle  41.0+-1.5
                 DUT snd
CPU App %usr     6.5+-0.3
CPU App %sys     93.4+-0.3
CPU App %irq     0.0+-0.0
CPU App %soft    0.0+-0.0
CPU App %idle    0.1+-0.0
CPU S-IRQ %usr   0.1+-0.3
CPU S-IRQ %sys   0.0+-0.0
CPU S-IRQ %irq   0.0+-0.0
CPU S-IRQ %soft  19.1+-0.8
CPU S-IRQ %idle  80.9+-0.8
Tests with RHEL 9.4
Red Hat Enterprise Linux 9.4 kernel is based on kernel-5.14.0-427.el9. That’s the one we tested here with the same procedure.
TCP throughput
The results were the same as with the previous ELN kernel, as seen in Figures 10-12 and their respective tables. So, there is nothing else to add here.
                 DUT rcv
CPU App %usr     3.0+-0.5
CPU App %sys     64.1+-0.7
CPU App %irq     0.0+-0.0
CPU App %soft    0.0+-0.0
CPU App %idle    32.9+-0.5
CPU S-IRQ %usr   0.0+-0.0
CPU S-IRQ %sys   0.0+-0.0
CPU S-IRQ %irq   0.0+-0.0
CPU S-IRQ %soft  100.0+-0.1
CPU S-IRQ %idle 0.0+-0.0 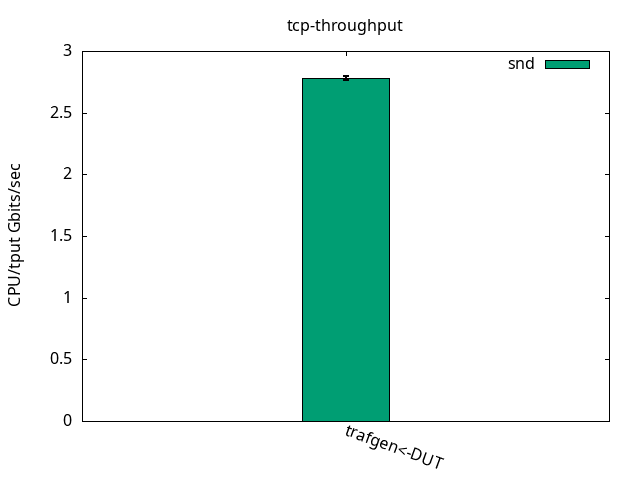
                 DUT snd
CPU App %usr     0.7+-0.2
CPU App %sys     58.4+-1.4
CPU App %irq     0.0+-0.0
CPU App %soft    0.0+-0.0
CPU App %idle    40.9+-1.3
CPU S-IRQ %usr   0.0+-0.0
CPU S-IRQ %sys   0.0+-0.0
CPU S-IRQ %irq   0.0+-0.0
CPU S-IRQ %soft  53.6+-0.9
CPU S-IRQ %idle  46.4+-0.9
UDP 1500 bytes
The results were quite the same as with the ELN kernel above, as can be seen in Figures 13-15 and their respective tables. Once again, I have nothing else to add here.
                 DUT rcv
CPU App %usr     7.6+-0.4
CPU App %sys     56.5+-0.7
CPU App %irq     0.0+-0.0
CPU App %soft    0.0+-0.0
CPU App %idle    35.9+-0.6
CPU S-IRQ %usr   0.0+-0.0
CPU S-IRQ %sys   0.0+-0.0
CPU S-IRQ %irq   0.0+-0.0
CPU S-IRQ %soft  99.9+-0.0
CPU S-IRQ %idle 0.0+-0.0 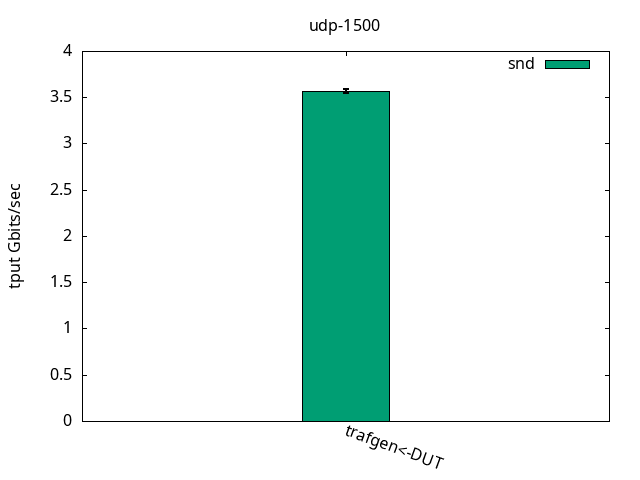
                 DUT snd
CPU App %usr     3.6+-0.2
CPU App %sys     96.3+-0.2
CPU App %irq     0.0+-0.0
CPU App %soft    0.0+-0.0
CPU App %idle    0.1+-0.0
CPU S-IRQ %usr   0.0+-0.0
CPU S-IRQ %sys   0.0+-0.0
CPU S-IRQ %irq   0.0+-0.0
CPU S-IRQ %soft  23.3+-0.5
CPU S-IRQ %idle  76.7+-0.5
UDP 60 bytes
Once again, the results were quite the same as with the previous ELN kernel, as seen in Figures 16-18 and their respective tables with nothing else to add.

                 DUT rcv
CPU App %usr     13.6+-0.5
CPU App %sys     86.4+-0.5
CPU App %irq     0.0+-0.0
CPU App %soft    0.0+-0.0
CPU App %idle    0.0+-0.0
CPU S-IRQ %usr   0.0+-0.0
CPU S-IRQ %sys   0.0+-0.0
CPU S-IRQ %irq   0.0+-0.0
CPU S-IRQ %soft  55.4+-0.9
CPU S-IRQ %idle  44.6+-0.9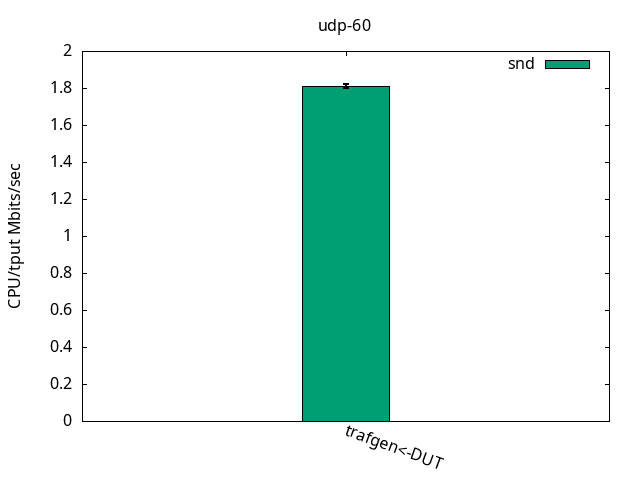
                 DUT snd
CPU App %usr     5.8+-0.3
CPU App %sys     94.1+-0.3
CPU App %irq     0.0+-0.0
CPU App %soft    0.0+-0.0
CPU App %idle    0.1+-0.0
CPU S-IRQ %usr   0.0+-0.0
CPU S-IRQ %sys   0.0+-0.0
CPU S-IRQ %irq   0.0+-0.0
CPU S-IRQ %soft  18.1+-0.4
CPU S-IRQ %idle  81.9+-0.4
Conclusions
The DUT server kept up with the traffic generator and sustained datacenter-level traffic, as it was able to with bare interfaces. It is worth mentioning that there are many techniques to scale the application when using UDP sockets, such as UDP GRO, UDP Segmentation Offload, RPS, RFS, XPS, etc. Also, the DUT server was launched mid-2020 and aarch64 designs often have plenty of cores which the applications can use to scale.
