Virtual Machines run on OpenShift Virtualization and are by default scheduled according to their vCPU and Memory needs, leading to a balanced distribution of the VMs across the existing worker nodes.
More resource requirements go into scheduling decisions, but for the sake of readability we limit to CPU and Memory in most examples in this post.
While the VMs are balanced according to their requested resources, the picture is different when we view the balance from a utilization point of view: While all VMs on the cluster are balanced from a requested resource perspective, the busy VMs might hog on a subset of nodes, impacting their performance negatively.
This scenario is shown in the diagram below:

In this blog post we are diving into how to detect that utilization is impacting workload performance, and what steps can be taken in order to improve the situation.
Problem
On OpenShift Virtualization - just like on many other virtualization platforms - CPU over-commitment is enabled by default for efficient CPU usage. One downside of CPU over-commitment is that at times CPU resource contention is occurring if there are too many busy VMs using the same CPU core.
Let’s take the example of where we have 4 equally sized VMs (i.e. 4 vCPUs each), spread across two nodes. While the VMs are equally sized, they differ in the resource utilization: On the first node, both VMs are busy (high CPU utilization), and on the second node, both VMs are idle (low CPU utilization). In this example, the VMs on the first node are likely to experience a negative performance impact due to CPU contention.
From a resource request perspective, the cluster is balanced, because all VMs have requested the same amount of CPU resources.
From a performance impact perspective, the cluster is not balanced, because the busy VMs are competing over resources, and on the node with the idle VMs, CPU resources are unused.
In an ideal world, the busy VMs should be spread across both nodes in order to use all available resources and therefore minimize the performance impact on each of them.
Workload performance and resource shortage
A workload running at 100% capacity is not necessarily a problem as long as it has all resources it needs available at every point in time.
But once a workload _is_ seeing a resource shortage, then this is having a negative impact on the workload’s performance. For example, if there is data to process available in memory, but no CPU time available anymore, then the VM is stalled due to CPU contention.
Given our earlier example of 2 idle VMs sharing a single CPU core, then there is likely no CPU contention, because the VMs are idle. However, the two other busy VMs on the second node are likely experiencing CPU contention, and therefore running with suboptimal performance.
As a side note: In an over-committed system, by definition, workloads are expected to not always get all the resources that they need, however, there are opportunities to improve such a situation.
Measuring utilization is not helping us to understand, if a workload is operating at its best performance. Instead of rebalancing based on total amount of resources a set of workloads are consuming; rebalance to minimize resource shortages across the workloads.

Solution
With the OpenShift Descheduler Operator there is already a tool to rebalance a cluster according to different strategies (profiles). Today however, the descheduler has no profile that is taking resource shortage into account.
Measuring resource shortage
The descheduler is removing workloads from nodes, thus in this context we have to identify nodes where we are seeing a high resource shortage. By removing workloads we’d reduce this shortage and in turn improve workload performance.
Thus the remaining question is how the system can identify nodes where workloads are seeing the highest performance impact due to resource shortage.
"PSI provides for the first time a canonical way to see resource pressure increases as they develop" is how Facebook is describing Pressure Stall Information (PSI) which it had developed, and contributed to the upstream Linux kernel over the past years. This tool - or metric - can measure CPU, Memory, and IO shortage of a process - or cumulatively at the node level. Thus instead of looking at the utilization of process which can be high but the process is still fine, this new metric allows us to observe when processes start to get into trouble.
This is very similar to the vCPU wait metric from the virtualization world, just generally available for all Linux processes.
After some some R&D and early investigation, PSI turned out to be a valuable metric to use in our use-case.
In the Kubernetes ecosystem, PSI is already exposed via the node-exporter, feeding the metric into Prometheus, which is a core component of the OpenShift Observability stack.
Descheduler - Reduce pressure on busy nodes
The OpenShift Descheduler Operator is configured using profiles that run on a configurable interval. Generally speaking, profiles have two phases:
-
Select nodes that should be considered for descheduling pods
-
Select one or more pods to be evicted
The existing Long-Lifecycle profile is already used for balancing long-running VMs by identifying overutilized nodes, and then descheduling VMs in order to level out the resource requests evenly across all nodes of a cluster.
In our work, we extended this profile to alternatively use node-level PSI information. The descheduler will gather per-node PSI metrics from Prometheus and classify the nodes as over, under, or appropriately utilized. If there are over and under utilized nodes, then the descheduler will start to evict pods - causing virtual machines to be migrated off the node. As a result the pressure of overutilized nodes will be reduced.
If the pressure is reduced enough, then it can actually happen that the node will be classified as under or appropriately utilized by the descheduler. Whether this happens depends on the overall cluster pressure.
Today the selection of the pod to be evicted is simply resembling the eviction order ot the kubelet.
Scheduling - Protect busy nodes from more pressure
Once a pod is getting evicted from a node - once a virtual machine is migrated off a node, then we want to ensure that it is not going to land on a busy node again.
Existing approaches such as the trimaran scheduler plugin relied on extending the Kubernetes scheduler. One of our objectives was to avoid adding a new direct dependency of the Kubernetes scheduler on the observability stack. Thus instead of following the trimaran approach, we decided to leverage existing scheduling mechanisms, specifically Taints which are used in order to steer pods away from certain nodes.
Taints are leveraged by the descheduler. Once it identifies an overutilized node, the descheduler will taint the node with the PreferNoSchedule effect, in order to steer workloads away from this node - if possible. Once a node is not overutilized anymore, the taint will be removed, and the node is available for scheduling again.
Summary
When we put all the pieces together, then the final picture is as follows: A modified OpenShift Descheduler Operator, with an extended Long-Lifecycle profile, using node level pressure measured using PSI via Prometheus.
We decided to implement this as an extension to the existing LongLifecycle OpenShift Descheduler Operator profile. The first part of our solution is the extension of the descheduler profile to
- Only start to rebalance once nodes cross a certain pressure threshold
- Only try to rebalance if there are underutilized nodes on the cluster
- Stop rebalancing if the cluster is reasonably balanced, and the expected gain is too low
- Use node pressure as a node ranking metric
The second part of the solution is to protect overutilized nodes, in order to avoid new workloads getting scheduled to them.
Validation approach
Objective
Our objective was to validate that the descheduler with the new profile was capable of leveling out the node-level CPU pressure (PSI) across all nodes in the cluster, in order to minimize the impact on workloads.
Measuring
The metrics used below are exported by any recent node_exporter by default, if PSI metrics are enabled on the Kernel level. In OpenShift these metrics are disabled by default, and were enabled using the following MachineConfigs for worker and the control plane nodes.
Base
The node level CPU pressure was measured using the following prometheus metric:
node_pressure_cpu_waiting_seconds_totalThat raw metric provides the monotonic increasing number of seconds where at least a workload was stalled waiting for an unavailable CPU.
More than the absolute number of seconds, we are interested the percentage of seconds where the resource was not available in the time period so we are interested in:
rate(node_pressure_cpu_waiting_seconds_total[1m])The result value will be a number between 0 and 1 indicating the ratio of time where some of the workload on the node was stuck due to unavailable CPU.
Balance
The balance of the pressure was measured as the standard deviation of CPU pressure between the worker nodes using the following formula:
stddev(sum by (instance) (rate(node_pressure_cpu_waiting_seconds_total[1m]) * on(instance) group_left(node) label_replace(kube_node_role{role="worker"}, 'instance', "$1", 'node', '(.+)')))Environment
A Red Hat Scalelab environment was used during testing, and consisted of
-
3 control plane nodes
-
10 worker nodes
The hardware of all involved nodes was equal:
$ oc describe worker d35-h24-000-r660
Name:            d35-h24-000-r660
Roles:           worker
…
Capacity:
  cpu:                         112
  devices.kubevirt.io/kvm:     1k
  devices.kubevirt.io/tun:     1k
  devices.kubevirt.io/vhost-net:  1k
  ephemeral-storage:           467566400Ki
  hugepages-1Gi:               0
  hugepages-2Mi:               0
  memory:                      527841984Ki
  pods:                        250
…
System Info:
  Machine ID:                          …
  System UUID:                         …
  Boot ID:                             590c18c0-32a4-4e6b-8a2c-c943459fafbd
  Kernel Version:                      5.14.0-427.47.1.el9_4.x86_64
  OS Image:                            Red Hat Enterprise Linux CoreOS 417.94.202412040832-0
  Operating System:                    linux
  Architecture:                        amd64
  Container Runtime Version:           cri-o://1.30.8-3.rhaos4.17.git359f960.el9
  Kubelet Version:                     v1.30.6
  Kube-Proxy Version:                  v1.30.6
…
$
Test scenarios
Scenario 1 - “A new node”
This scenario can be described as follows:
-
Random distribution of VMs with the same CPU requests, but one with a high CPU load and the other group with a low CPU load
-
Then taking a new node into operations
-
And finally enabling rebalancing
Expected Result
The expected result is a balanced cluster according to the node pressure.

Scenario 2 - “Extreme imbalance”
This scenario can be described as follows:
-
Evenly partitioned cluster
-
VMs with same CPU requests, in one partition VMs with a high CPU load, and in the other partition VMs with a low CPU load
-
And finally enabling rebalancing
This scenario is illustrated in the following diagram:

Expected Result
Just like in scenario 1, the expected result is a balanced cluster according to the node pressure.

Evaluation
The evaluation of our solution was done using the following upstream report repository: https://github.com/openshift-virtualization/descheduler-psi-evaluation
Test scripts covering the two scenarios are available at https://github.com/openshift-virtualization/descheduler-psi-evaluation and they can easily be reproduced in different environments.
The first step is ensuring that the cluster is properly configured with all the required components.
$ bash to.sh deployCan be used to apply a few manifests to configure the cluster. In details:
10-mc-psi-controlplane.yaml   # to enable PSI at Kernel level for controlplane nodes
11-mc-psi-worker.yaml         # to enable PSI at Kernel level for worker nodes
12-mc-schedstats-worker.yaml  # to enable shedstat at Kernel level for worker nodes
The required operators are then going to be deployed and configured.
20-namespaces.yaml               # to create required namespaces
30-operatorgroup.yaml            # to create operatorgroups
31-subscriptions.yaml            # to create operator subscriptions
40-cnv-operator-cr.yaml          # to configure OpenShift Virtualization (vanilla configuration)
41-descheduler-operator-cr.yaml  # to configure Kube Descheduler Operator (custom)
50-desched-taint.yaml            # custom component to taint nodes according to actual utilization
The e2e test can be executed with:
$ export TEST_SCENARIO=1 # or TEST_SCENARIO=2 to choose the desired test scenario
$ bash to.sh apply
$ bash e2e-test.sh
Test artifacts
The e2e test will act on two VirtualMachinePools: a VirtualMachinePool is ensuring that a specified number of VirtualMachine replicas are in the ready state at any time.
00-vms-no-load.yaml              # a pool of idle VMs
01-vms-cpu-load.yaml             # a pool of CPU intesive VMs
The VMs in the two pools are configured to require the same amount of CPU and memory.
The VMs in the no-load pool are completely idle; the VMs in the cpu-load pool are configured to execute OpenSSL Algorithm Speed Measurement in a continuous loop to stress the CPU.
Test flow
The general test flow for the two scenarios can be summarized in the following sequence:
- Scale down existing VM pools and deactivate the descheduler to ensure a clean environment.
- Start generating load according to the scenario.
- Scale up the load until it reaches a certain threshold.
- Store the standard deviation of the CPU PSI pressure across the worker nodes as a future reference.
- Trigger the descheduler and gave it enough time (10 minutes) to start rebalancing the cluster
- Ensure that the standard deviation of the CPU PSI pressure across the worker nodes is lower than in the unbalanced initial situation.
- Continue observing the cluster for 1 hours to ensure that it converges and remain in a balanced status
- Clean up.
Test results
Scenario #1
Test started at 09:45 progressively creating the same amount of VMs in the CPU intensive and in the no-load pools.
Over the 10 worker nodes in the lab, 3 nodes were initially tainted so about 700 VMs (350 generating load, 350 no) got equally spread across 7 nodes. No VMs on the 3 initially tainted nodes.
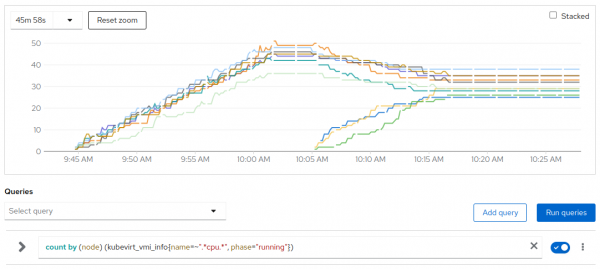
# of CPU intensive VMs per node
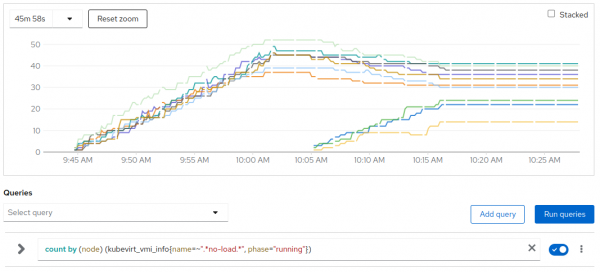
# of no-load VMs per node
Around 10:02 the average pressure reached the trigger threshold; load ramp got stopped and the system settled for 3 minutes till 10:05.
At 10:05 the last three nodes got untainted becoming schedulable and the descheduler got triggered.
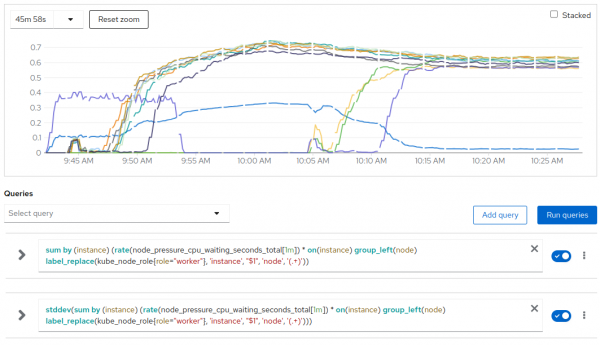
CPU pressure per node and stddev (blue)
The descheduler quickly started migrating both CPU intensive and no-load VMs to the tree spare nodes.
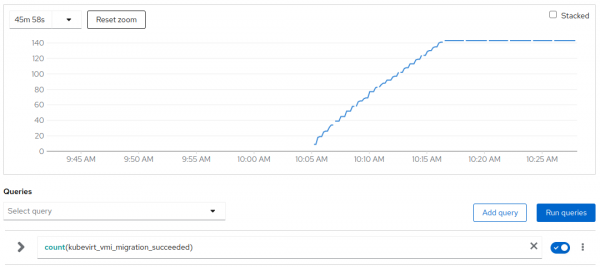
# of migrations in the cluster
Migrations continued till 10:17 when the system reached a balanced status and no other migration got triggered.
In total the descheduler triggered around 140 migrations to move around 135 VMs over the 700 active ones.
In this scenario the active VMs/migration ratio is really good reaching 96%.
Around 10:17 the stddev of CPU pressure was around 0 since the CPU pressure was now equally distributed within the 10 active nodes.
Please notice that CPU pressure is not a linear metric so the average CPU pressure at the end (after 10:17) was still around 0.6 where the peak at 10:02 was about 0.7.
In total we have 350 CPU intensive VMs, at 10:02 they were executed by 7 worker nodes with an average of 50 each, at the end of the test they were spread across 10 nodes with an average of 35 each. We can clearly see that the average pressure at the end (with 35 VMs each on average) is pretty close to the average pressure recorded at 09:57 at ⅔ of the ramp up with about 35 CPU intensive VMs for each of each of the 7 active nodes. So, even if CPU pressure is not a linear metric, we can easily conclude that after the rebalancing it reached again the expected value.
Scenario #2
The test started at 07:35. The cluster worker nodes go split into two partitions: half of the nodes got cordoned, the other five were still schedulable.
Due to the pressure generated by system pods, the tainter (soft)-tainted two nodes to protect them from excessive loading so the CPU intensive VMs were initially scaled up only on 3 nodes.
At 08:06 we had about 250 CPU intensive VMs spread across three worker nodes and this was enough to generate enough average pressure and stop the rump up.
The system settled for 3 minutes and around 08:09 the cordoned and uncordoned partitions got flipped.
Now another set of 250 no load VMs got started on the second half of the nodes.
At 08:10 the cluster is fully unbalanced: we have 250 CPU intensive VMs on 3 nodes, and 250 no-load VMs on the other 5 nodes. 2 nodes are not executing VMs due to the taints caused by other system pods.
Around 08:12 all the 10 worker nodes got uncordoned becoming schedulable.
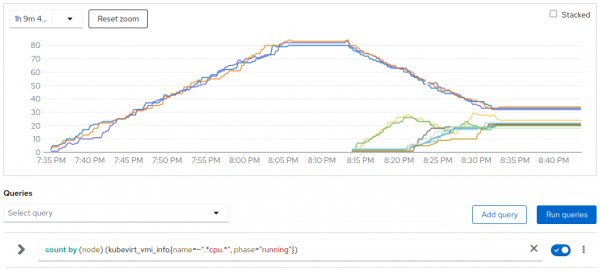
# of CPU intensive VMs per node
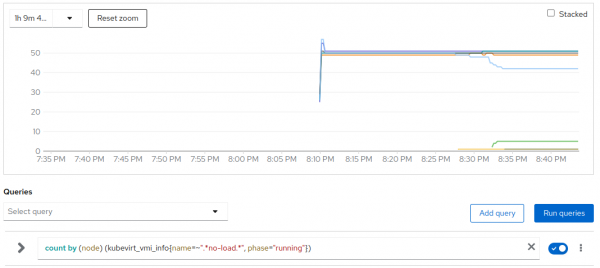
# of no-load VMs per node
Around 08:05 the pressure was at its peak.The no load VMs started at 09:09 didn’t increase it.
Around 08:14 the scheduler got activated and we quickly saw a ramp up in the CPU pressure for the nodes that were not running any CPU intensive VM.
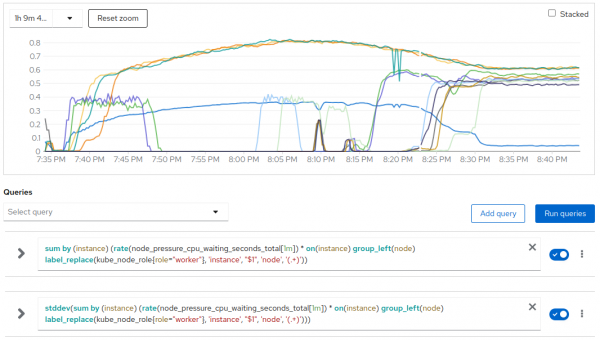
CPU pressure per node and stddev (blue)
At 08:14 the descheduler started migrating basically only CPU intensive VMs from the under pressure partition of worked nodes to the others. From the graph of no-load VMs, we clearly see that between 08:12 and 08:28 no one of the no-load VMs migrated, only later on around 08:32 a few no-load VMs got migrated to complete the balancing.
Please notice from the graph of the CPU intensive VMs per node, that the initially loaded nodes ended with about 30 CPU intensive VMs each where the other seven nodes ended with about 20 VMs each but they are also caring the 250 no-load VMs that got initially created there and just a few (<10) got migrated.
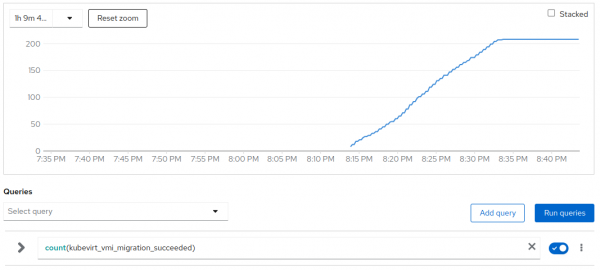
# of migrations in the cluster
Migrations stopped at 08:34 when the system reached a balanced status.
In total the descheduler triggered around 200 migrations while the balancing required to move around 150 VMs over the 500 active ones.
In this case the affected VMs/migrations ratio is lower being around 75% but the cluster was extremely unbalanced.
Around 08:32 the stddev of CPU pressure was around 0 since the CPU pressure was now equally distributed within the 10 active nodes.
Also in this scenario we clearly see that CPU pressure is not a linear metric so the average CPU pressure at the end (after 08:32) is about 0.55 across the 10 active workers that are running between 20 and 30 CPU intensive VMs each.
The 3 initially active nodes were reporting an average 0.55 pressure around 07:42 where on average they were executing 25 CPU intensive VMs each so also in this scenario we can easily conclude that after the rebalancing the CPU pressure reached again on average the expected value and its stddev between nodes is close to 0.
Try it out & getting started
This blog post is based on the Developer Preview of load aware rebalancing in OpenShift Virtualization. OpenShift 4.17 with the up to date version of the OpenShift Descheduler Operator is sufficient to reproduce these results in your own lab.
The essentials to get started are:
- Reconfigure the MachineConfigPools in order to expose PSI metrics
- Deploy and configure the OpenShift Virtualization and Descheduler Operators
- Deploy the node tainer component
All of these steps are accomplished by running
$ git clone https://github.com/openshift-virtualization/descheduler-psi-evaluation.git
Cloning to 'descheduler-psi-evaluation'...
…
$ cd descheduler-psi-evaluation
$ oc login …
$ bash to.sh deploy
…
$
Now you are all set and ready to go. All new and existing VMs will be rebalanced every 60 seconds.
Conclusion
We were able to validate that the changes to the descheduler and the inclusion of a component to taint nodes according to pressure is leading to evenly distributed busy workloads and reducing the pressure on individual workloads.
Next Steps
There are some immediate next steps
- Improve and merge the node taint implementation
- Graduate the extended profile to GA and ship it as part of OpenShift after additional scale and performance evaluation
Future topics
- Provide feedback to Kubernetes KEP 4205 about the impact of limited workloads on node pressure. Get involved to drive this KEP forward.
- Investigate how PSI can be used in node pressure eviction
- Can PSI help to right size workload requests?
