Page
Observability with large language models and Node.js with Open Telemetry

In order to get full benefit from taking this lesson, you need to:
- An OpenShift cluster
- The environment set up in earlier lessons. If you were running Ollama locally you will need to modify your configuration so that it can be accessed from your OpenShift cluster
As with the other lessons you can follow along with the lesson without installing and running the examples.
In this lesson, you will:
- Explore how a Node.js application can be instrumented to capture traces when interacting with an LLM.
- Run an instrumented Node.js application and observe the traces in Jaeger
Setting up the environment
Installing and configuring the Red Hat Build of Open Telemetry
In order to capture traces from an instrumented Node.js application we’ll use the Red Hat Build of Open Telemetry. You will need to follow the installation instructions to install it into your OpenShift cluster. After installing the operator, for both the subsequent steps as part of the installation, configuring the collector, and deploying the Node.js application we used the ai-otel namespace. When creating the tempo instance we used the name sample which was the default in the operator UI.
Once the Red Hat Build of Open Telemetry is installed you will then need to configure an Open Telemetry collector as outlined in this section. We chose the option which does not use a sidecar, and that is reflected in the configuration in the files within lesson-4. All of the required environment variables outlined in that section are set through the ‘.env’ file included in lesson-4:
OTEL_SERVICE_NAME="AI-experimentation"
OTEL_EXPORTER_OTLP_ENDPOINT=http://otel-collector:4317
OTEL_TRACES_SAMPLER=parentbased_always_on
OTEL_EXPORTER_OTLP_PROTOCOL=grpc
OTEL_LOG_LEVEL=DEBUG
OTEL_EXPORTER_OLTP_INSECURE=False
We found that we needed to grant some additional privileges for the collector to be able to start over and above what was suggested in the documentation when creating the service account for the collector. Those are shown in the "apiGroups" below:
apiVersion: v1
kind: ServiceAccount
metadata:
  name: otel-collector-sidecar
  namespace: ai-otel
---
apiVersion: rbac.authorization.k8s.io/v1
kind: ClusterRole
metadata:
  name: otel-collector
rules:
- apiGroups: ["", "config.openshift.io"]
  resources: ["pods", "namespaces", "infrastructures", "infrastructures/status"]
  verbs: ["get", "watch", "list"]
- apiGroups: ["apps"]
  resources: ["replicasets"]
  verbs: ["get", "watch", "list"]
---
apiVersion: rbac.authorization.k8s.io/v1
kind: ClusterRoleBinding
metadata:
  name: otel-collector
subjects:
- kind: ServiceAccount
  name: otel-collector-sidecar
  namespace: ai-otel
roleRef:
  kind: ClusterRole
  name: otel-collector
  apiGroup: rbac.authorization.k8s.io
Once installation is complete you should be able to see both the tempo instance installed as part of the Red Hat Build of Open Telemetry and the Open Telemetry collector:
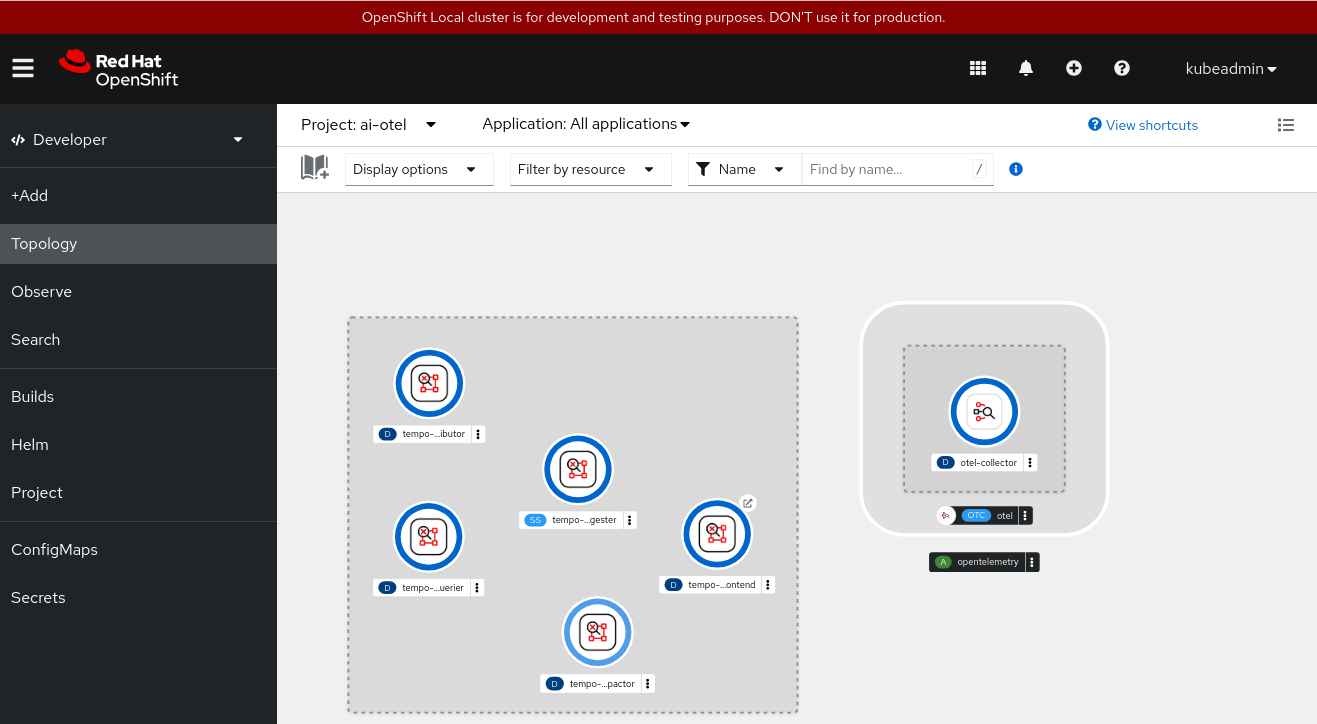
Installing nodeshift
We use nodeshift to easily deploy the Node.js application to our OpenShift cluster. To install it run:
npm install -g nodeshiftInstrumenting your LLamaindex.TS application
Open Telemetry is one of the leading projects for instrumenting applications. It includes support for a number of languages including JavaScript - opentelemetry-js. This library provides a set of APIs that you can use to instrument your application. While you may want to add additional instrumentation to your application the good news is that there are already packages that will auto-instrument existing libraries.
LLamaindex.ts currently recommends two libraries for observability, both which are built on Open Telemetry. We will use openllmetry-js. In addition to being able to instrument LLamaindex.ts it also supports other popular LLM related libraries including:
https://github.com/traceloop/openllmetry-js#-what-do-we-instrument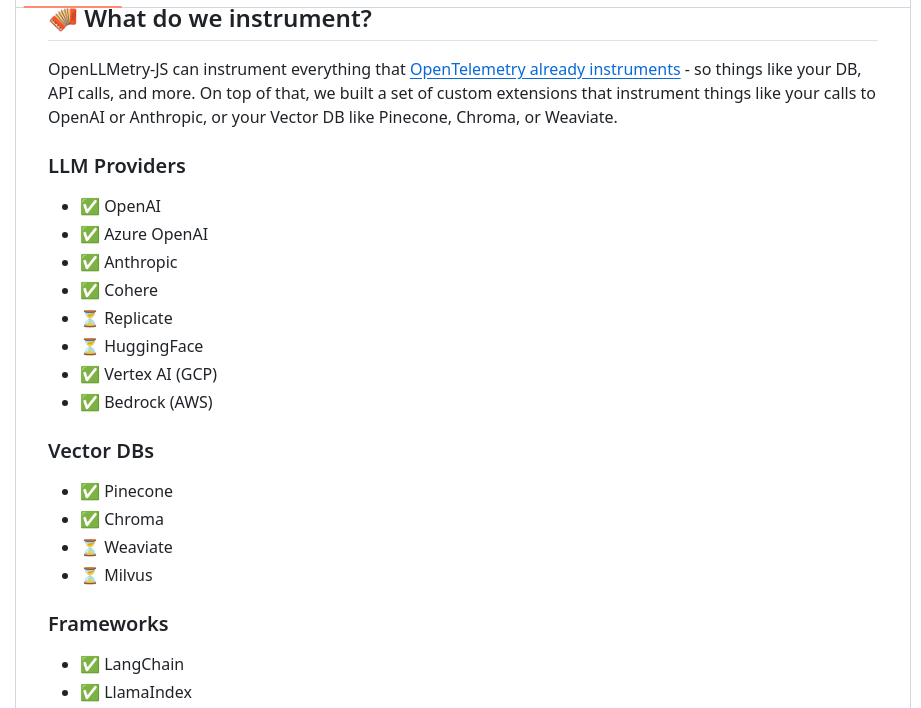
To instrument the application for the previous lesson we converted the section that asks the LLM questions to an export so that it could be imported and called from another file. The only additions were the line with the export and the closing parenthesis in llamaindex-function-ollama.mjs:
////////////////////////////
// ASK QUESTIONS
export async function askQuestions() {
  const questions = ['What is my favorite color?',
                     'My city is Ottawa',
                     'My country is Canada',
                     'I moved to Montreal. What is my favorite color now?',
                     'My city is Montreal and my country is Canada',
                    ];
  for (let i = 0; i< questions.length; i++) {
    console.log('QUESTION: ' + questions[i]);
    let response = await chatEngine.chat(getQuery(questions[i]));
    console.log('  RESPONSE:' + (await handleResponse(chatEngine, response)).response);
  }
}
Otherwise this part of the example is the same as we used in the previous lesson when exploring function calling.
In order to instrument this existing functionality we then created the wrapper otel-tracing.mjs. The code in this wrapper starts out with the code needed to load openllmetry.js (traceloop), instrument LlamaIndex and initialize the underlying Open Telemetry infrastructure so that it can reach the collector.
The order in which the initialization is done is important, and the lines under instrumentModules section in the object passed into initialize are what indicate that LLamaIndex should be instrumented. In many cases the instrumentation should be automatic after importing @traceloop/node-server-sdk, but that did not work for us.
import * as traceloop from "@traceloop/node-server-sdk";
import { trace, context } from "@opentelemetry/api";
import * as LlamaIndex from "llamaindex";
import { OTLPTraceExporter } from "@opentelemetry/exporter-trace-otlp-grpc";
import { ConsoleSpanExporter } from "@opentelemetry/sdk-trace-node";
traceloop.initialize({ exporter: new OTLPTraceExporter(),
                        disableBatch: true,
                        instrumentModules: {
                          llamaIndex: LlamaIndex,
                        }
                      });
The next part gets an instance of the tracer and creates a span which wraps all of the calls which are made when we call the askQuestions() function.
const tracer = trace.getTracer();
import {askQuestions} from "./llamaindex-function-ollama.mjs"
tracer.startActiveSpan('Asking questions', async (span) => {
  await askQuestions();
  span.end();
});
Creating a top level span ensures that all of the spans reported by the interactions with the LLM in askQuestions() are grouped together.
We also add a small piece of code at the end of the wrapper that keeps the application running after it is deployed to OpenShift so that you can use the terminal to access the pod in which it is running and experiment:
setInterval(() => {
  console.log('alive');
}, 5000);
Running the instrumented Node.js application and capturing traces.
We can now deploy the application to the OpenShift Cluster and observe the output. To do this
1. Log into the openshift cluster as kubeadmin and change to the ai-otel workspace
2. Change into the lesson-4 directory
cd lesson-43. Run nodeshift
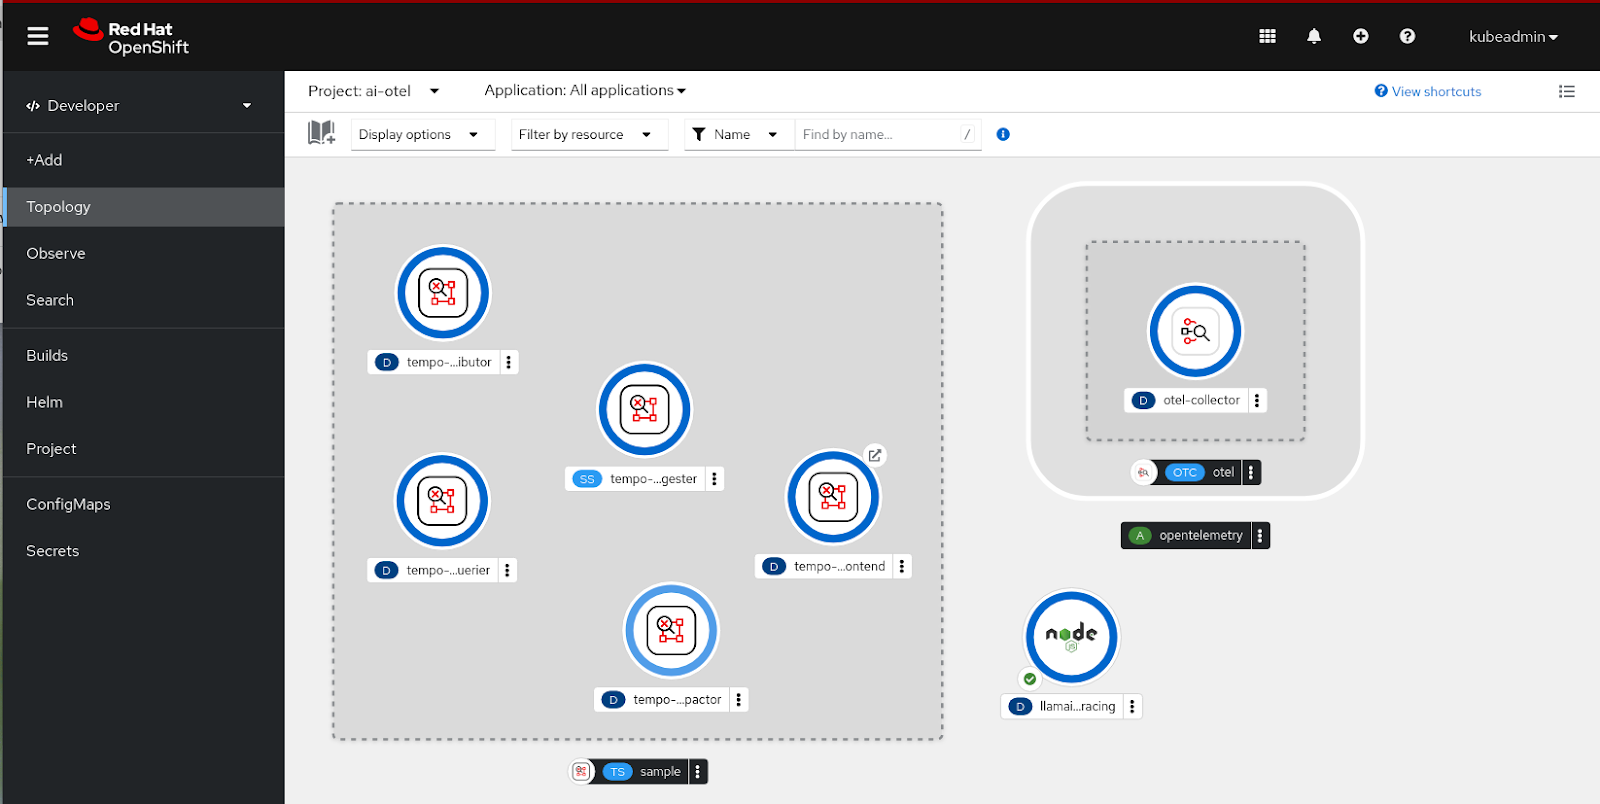
nodeshift --use-deployment=trueAfter you run nodeshift the contents of the current directory will be transferred over to the OpenShift cluster, a BuildConfig will be created, and then a Deployment will be created and deployed to the namespace. You should now see your application running alongside the Open Telemetry collector and the tempo instance.
If you look at the logs for the pod for the Node.js application you can see that because the environment variable
OTEL_LOG_LEVEL=DEBUGwas set in the .env file, in addition to the output we saw in the last session we also see output like this:
'gen_ai.prompt.0.content': '\n' +
'You are a helpful research assistant but do not mention that. The following functions\n' +
'are available for you to fetch further data to answer user questions, if relevant:\n' +
'\n' +
'[{\n' +
' "function": "favoriteColorTool",\n' +
' "description": "returns the favorite color for person given their City and Country",\n' +
' "arguments": [\n' +
' {\n' +
' "name": "city",\n' +
' "type": "string",\n' +
' "description": "the city for the person"\n' +
' },\n' +
' {\n' +
' "name": "country",\n' +
' "type": "string",\n' +
' "description": "the country for the person"\n' +
' }\n' +
' ]\n' +
'}]\n' +
'\n' +
'To call a function respond - immediately and only - with a JSON object of the following format:\n' +
'{\n' +
' "function": "function_name",\n' +
' "arguments": {\n' +
' "argument1": "argument_value",\n' +
' "argument2": "argument_value"\n' +
' }\n' +
'}\n' +
'\n' +
'Only use one of these tools if it is relevant to the question. \n' +
'\n' +
'When using the favoriteColorTool if you do not have the users city and Country\n' +
'ask for it first. Do not guess the users city.\n' +
'\n' +
'Do not not mention any tools\n' +
'\n' +
'Do not show JSON when asking user for a city or country\n' +
'\n' +
'\n' +
The gen_ai.prompt.X lines are debug output showing the information that was captured for the traces and will have been sent to the Open Telemetry collector.
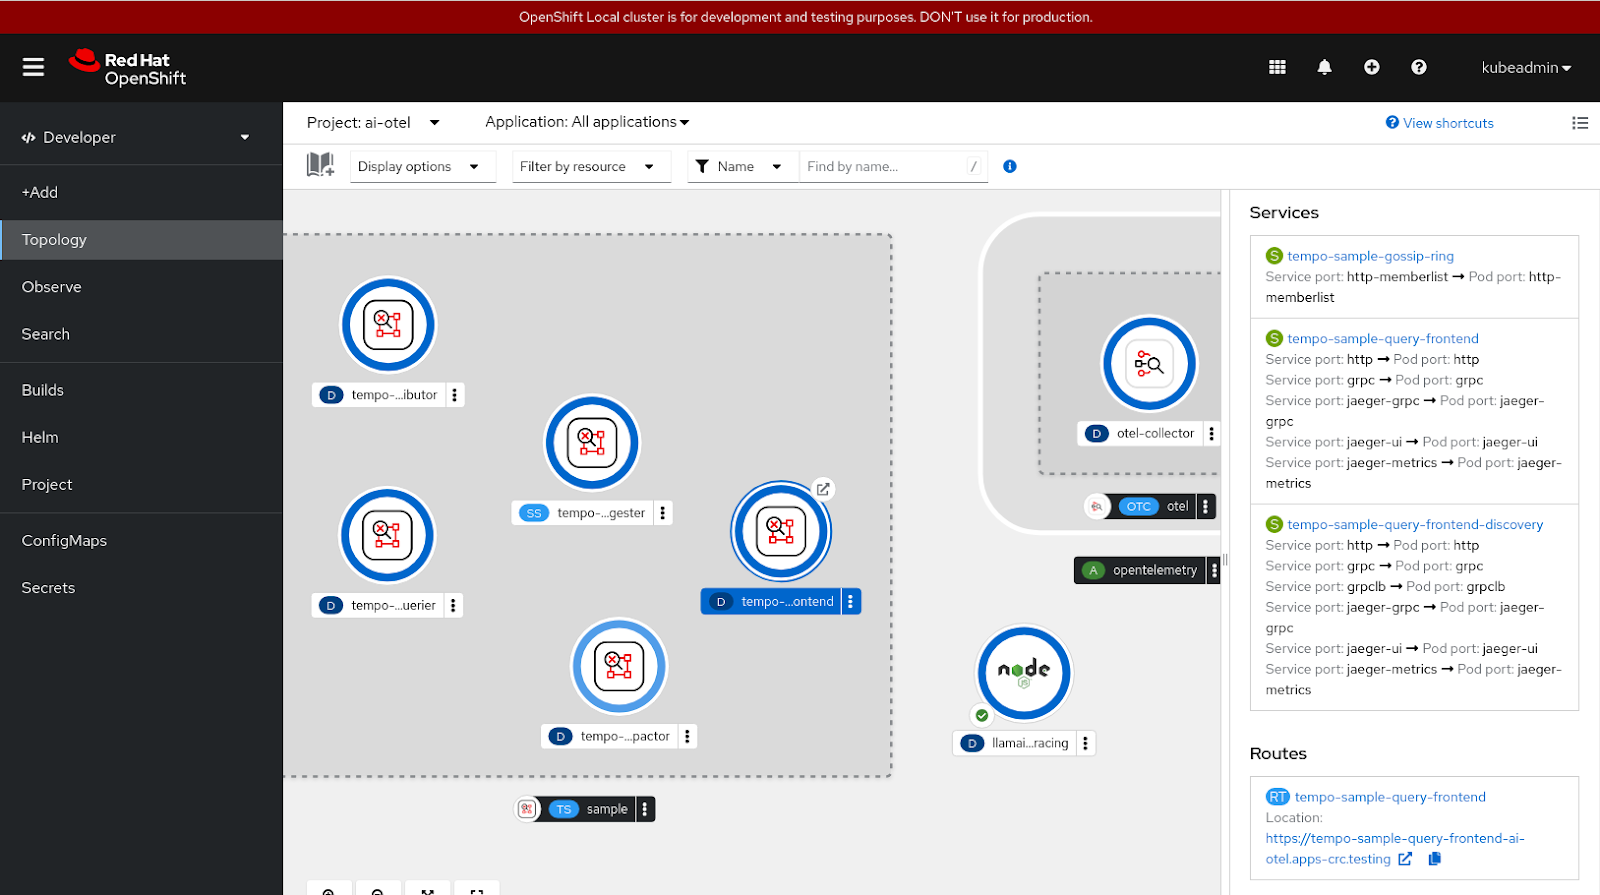
Now let's take a look at the traces through the Red Had Build of OpenTelemetry which includes Jaeger. You can get the Jaeger UI by selecting the icon for the tempo-sample-query-frontend, selecting the Resources tab and then scrolling down to find the link under the Routes section:
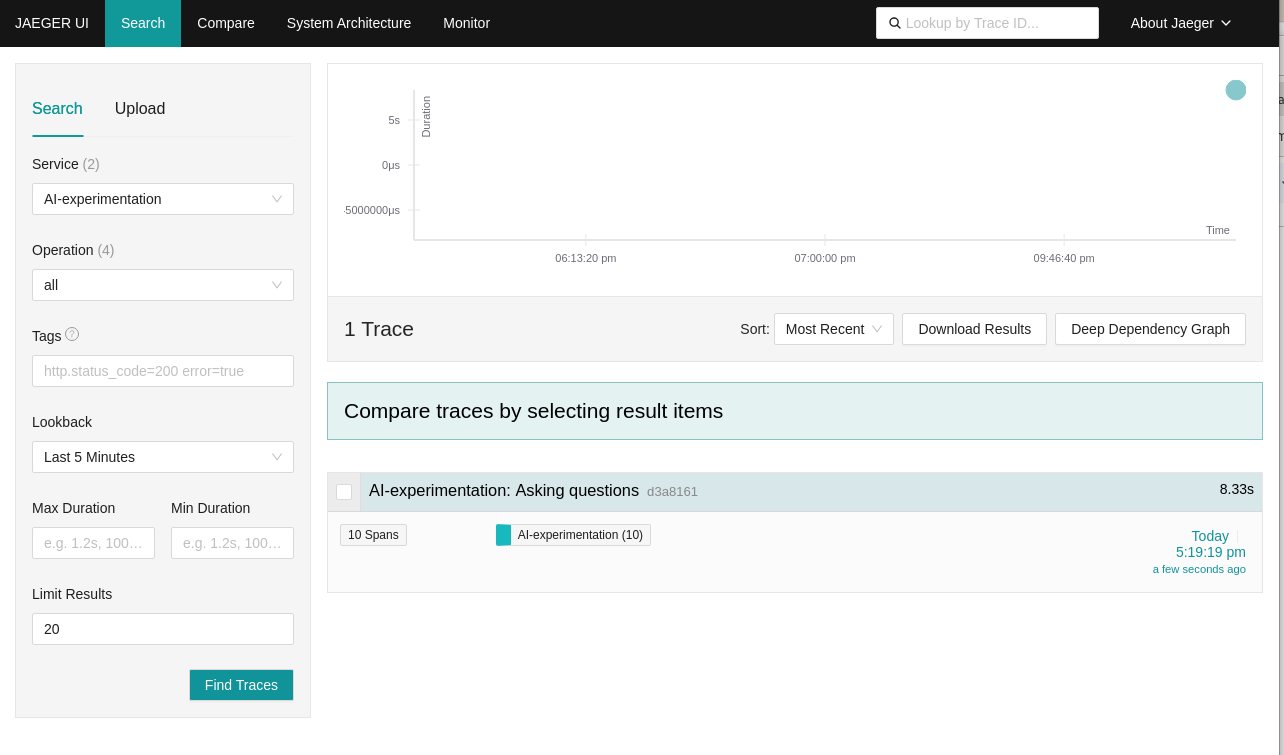
When you click on that link you will be taken to the Jaeger UI where Service should already be populated with “AI-experimentation” which is the service name we set through the
OTEL_SERVICE_NAME="AI-experimentation"environment variable in the .env file. Select “Find traces” and you should see the trace for the run when the pod started:
The top level span is named “Asking questions” as we had set when we created the top level span:
tracer.startActiveSpan('Asking questions', async (span) => {
  await askQuestions();
  span.end();
});
If we select the top level span we will then see the sub-spans:
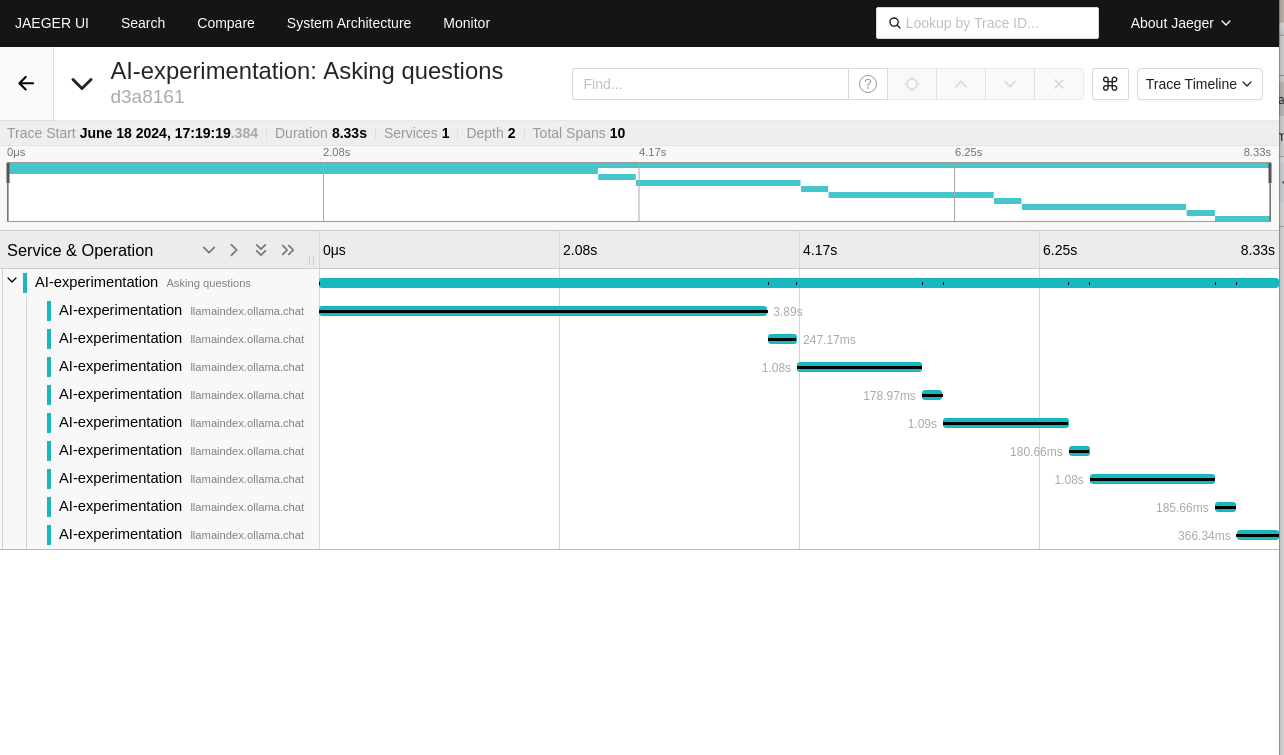
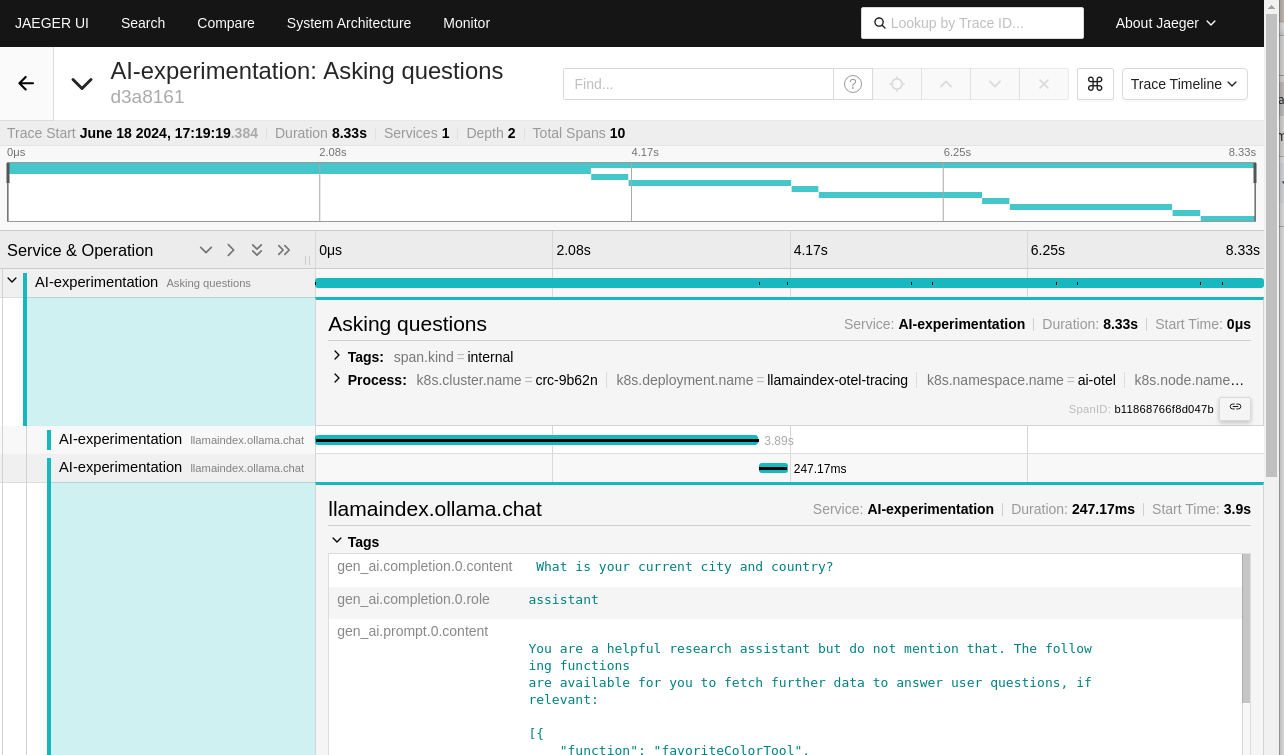
It’s interesting to see that there are more than the number of questions we asked. This is because the example will automatically call the LLM when a request to run a function is received. We can see the details of each chat request with the LLM by selecting the trace for the request:

From this we can see that the first trace capture is for the initial question, and the response (in gen_ai.completion.0.conent) at the top is the request to run a function:
{
    "function": "favoriteColorTool",
    "arguments": {
        "city": "Your City",
        "country": "Your Country"
    }
}
The example will respond to that request by calling the function and returning the result to the LLM. We can see that happening in the next span in the trace:
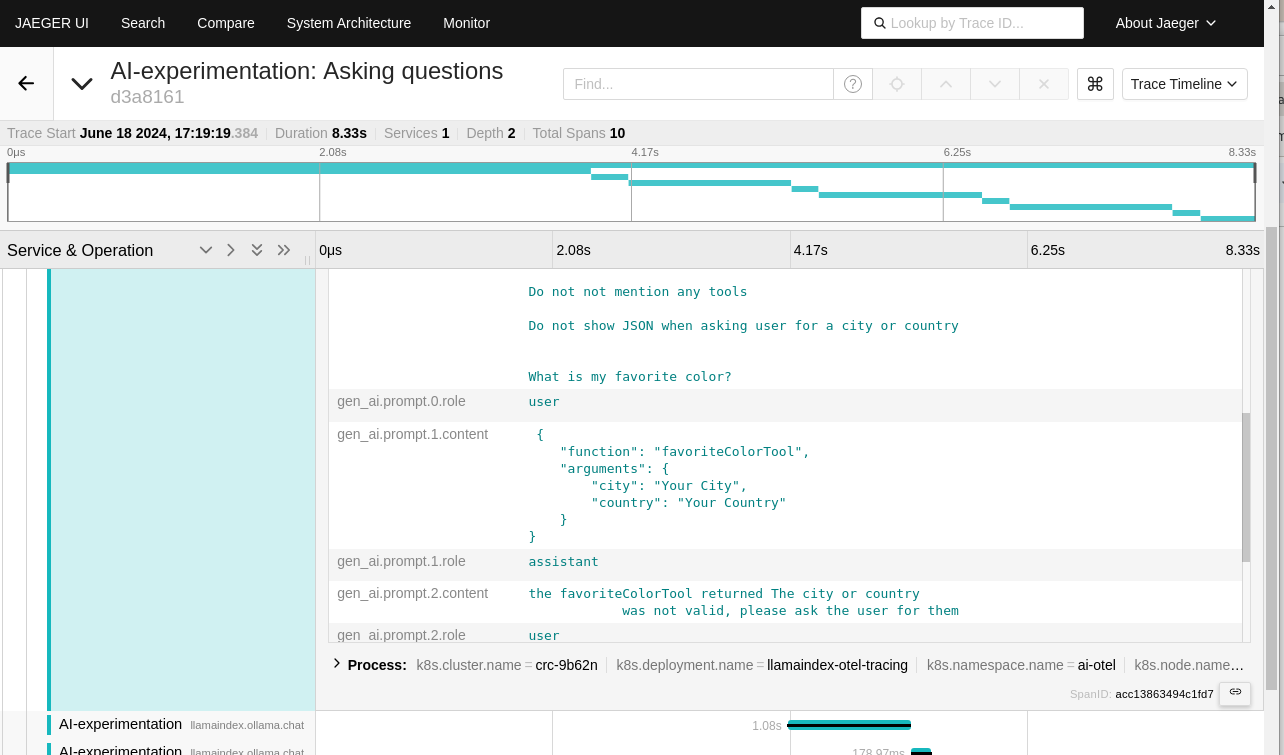
From this span we can see that the response from the function call:
gen_ai.prompt.2.content
the favoriteColorTool returned The city or country
            was not valid, please ask the user for them
And then the LLM asking the user for the city and country:
gen_ai.completion.0.content
What is your current city and country?
You can also see that the context for the request includes the original question and context. This is because the SimpleChatEngine maintains a history of the back and forth on the chat to maintain prior context.
It can be quite helpful to be able to observe the traces for a request. Knowing the time each of the questions took, and being able to see the flow and details can help when problems are reported. On the flip side it’s also important to be aware of what information is being captured and to ensure that no sensitive information is captured when it should not be.
What’s nice about leveraging Open Telemetry to capture interactions with an LLM is that the same tooling can also capture traces for other parts of your application. For example, if your function call made a database request, there is likely auto-instrumentation for that database that could be used and the trace would then include the timing and details of the calls to the database as well.
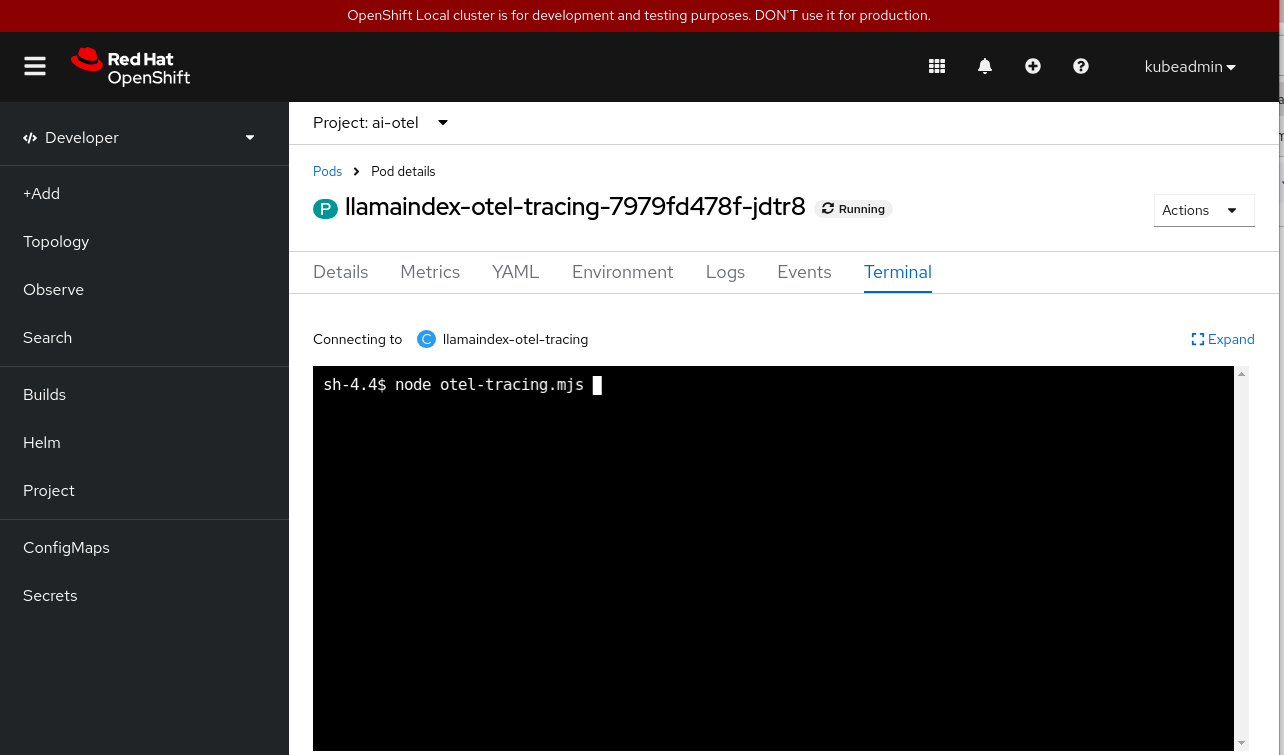
You can now experiment by running the program from the terminal for the node.js application pod and then look at the different flows captured in each of the top level span.
To close out on this section its good to know that the existing tools like Open Telemetry and enterprise support for tracing as provided in products like the Red Hat Build of Open Telemetry can be used to observe Node.js applications which integrate LLMs just like any other component of an enterprise application.
Summary
At this point we’ve walked you through
- Setting up and using Ollama
- Using LLamaIndex.ts and run a Node.js program that makes some requests to an LLM running with Ollama
- Running Node.js applications that demonstrates the use of Function calling /Tool use with and without agents.
- Generating traces from a Node.js program built with LLamaIndex.ts, and capturing those traces with Open Telemetry and viewing them in a Jaeger front end all running under OpenShift.
We hope this learning path has helped you understand some of the key topics when it comes to integrating large language models into your Node.js and JavaScript applications.
Want to learn more check out:
- https://developers.redhat.com/topics/nodejs
- https://github.com/nodeshift/nodejs-reference-architecture
