Creating Grafana dashboards from scratch can be a tedious process. To help grafana-pcp users get started visualizing Performance Co-Pilot (PCP) metrics immediately, the Performance Co-Pilot plugin for Grafana includes some premade dashboards. The grafana-pcp plug-in and the 3 included datasources each have dashboards that a user can import.
These dashboards do a great job of getting a user started and visualizing a lot of important metrics in a useful way; however, different use cases call for different visualizations. There might be a common use case that does not yet have a premade dashboard bundled in the grafana-pcp plug-in.
The premade dashboard files in the grafana-pcp plug-in are .jsonnet files. They can be found along with the rest of the grafana-pcp sources in the Performance Co-Pilot Grafana plug-in GitHub repository. The dashboard files are located in the following directories:
Plug-in dashboards:
src/dashboardsVector dashboards:
src/datasources/vector/dashboardsRedis dashboards:
src/datasources/redis/dashboardsbpftrace dashboards:
src/datasources/bpftrace/dashboards
For a new premade dashboard for the vector datasource, a new Jsonnet file would be created in src/datasources/vector/dashboards.
Using one of the current Jsonnet files as a guide can help get the dashboard started.
Example: Top CPU consuming processes dashboard
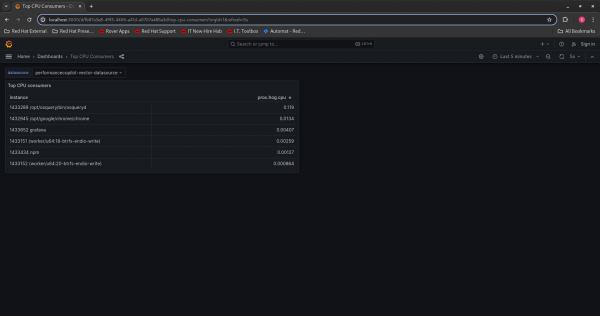
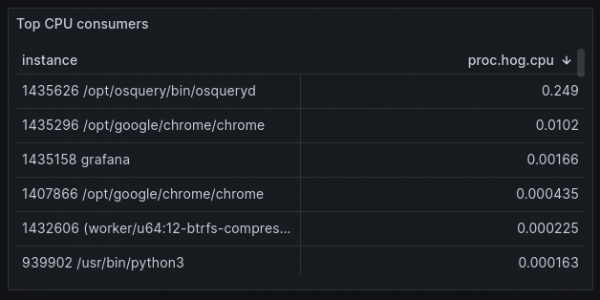
Figure 1 shows the full finished dashboard and Figure 2 shows a zoomed-in view of the table from the finished dashboard. The following guide goes through developing this dashboard as a premade Jsonnet file in the grafana-pcp plug-in.


Create a file named pcp-vector-top-cpu-consumers.jsonnet in src/datasources/vector/dashboards and on the first line, import the Grafana library for Jsonnet:
local grafana = import 'grafonnet/grafana.libsonnet';Next, create the dashboard for the datasource. The example below is creating a dashboard for the PCP Vector datasource. The title of the dashboard is "Top CPU Consumers". The dashboard will display metrics from the last 5 minutes (now-5m). Every 5 seconds, the visualization will refresh (update the data). See below:
grafana.dashboard.new(
    'Top Consumers',
    tags=['pcp-vector'],
    time_from='now-5m',
    time_to='now',
    refresh='5s',
)
.addTemplate(
  grafana.template.datasource(
    'datasource',
    'performancecopilot-vector-datasource',
    'PCP Vector',
  )
)
Now that the dashboard is set up, visualizations can be added. In this example, we are creating a table. There are examples of graph panels (time series) and other types of visualizations in the other dashboards bundled with grafana-pcp. It is recommended to use these as a guide when creating a visualization of the same type.
This table will have the title "Top CPU Consumers" and track the proc.hog.cpu metric, which displays the amount of CPU a process is using. The table sorts the instances by their value of proc.hog.cpu in descending order. The resulting visualization lists the processes on a system by their amount of CPU consumption, which can help identify processes that may be using too much CPU.
The size of the table is determined by the values of w and h. The table's position is denoted by the values of x and y. See below:
.addPanel(
    grafana.tablePanel.new(
        'Top CPU consumers',
        datasource='$datasource',
        styles=null,
    )
    .addTargets([
        { expr: 'proc.hog.cpu', format: 'metrics_table', legendFormat: '$metric' },
    ])  + { options+: {sortBy: [{desc: true, displayName: 'proc.hog.cpu'}]}}, gridPos={
        x: 0,
        y: 0,
        w: 12,
        h: 8,
    }
)
Test the dashboard
After creating the Jsonnet file and making a first draft of the dashboard, it is time to test the dashboard out on Grafana.
To test the dashboard, it must first be compiled into JSON. This step requires the Grafonnet library and the Jsonnet compiler. To make Grafonnet available, pull down the Grafonnet library into the same directory as the new Jsonnet file:
git clone https://github.com/grafana/grafonnet-lib.gitThen, install the Jsonnet compiler:
yum install jsonnetRun the following to to compile the Jsonnet into JSON:
jsonnet -J ./grafonnet-lib pcp-vector-top-cpu-consumers.jsonnet -o pcp-vector-top-cpu-consumers.jsonThe newly created JSON file can now be imported into Grafana to test out the dashboard. In Grafana, when creating a new dashboard, it provides the option to Import dashboard. Choose that option and then upload the JSON file and click Import to create the dashboard in Grafana.
For this dashboard to work, the PCP Vector datasource must be set up with authentication because the proc metrics (proc.hog.cpu) require authentication. You can find the steps for setting up authentication in the grafana-pcp docs: Authentication — grafana-pcp 5.1.2 documentation
Get the dashboard into grafana-pcp
To include the dashboard with the PCP Vector datasource, the new dashboard must be added to the PCP Vector datasource's plugin.json. In src/datasources/vector/plugin.json, add the following block:
        {
            "type": "dashboard",
            "name": "PCP Vector: Top CPU Consumer",
            "path": "dashboards/pcp-vector-top-cpu-consumers.json"
        }
Once the dashboard is ready to be shared, you can open a pull request for the grafana-pcp project with the new Jsonnet file and the addition to the datasource’s plugin.json. Follow this link to the grafana-pcp GitHub repository.
Next steps: Try it yourself
The example and steps provided in this article serve as a good starting point for new dashboard development. With the vast number of PCP metrics and expansive set of use cases, grafana-pcp users are in a strong position to develop dashboards that could benefit both themselves and the grafana-pcp community.
